Approximate Bayesian computation scheme for parameter inference and model selection in dynamical systems - PubMed (original) (raw)
Comparative Study
Approximate Bayesian computation scheme for parameter inference and model selection in dynamical systems
Tina Toni et al. J R Soc Interface. 2009.
Abstract
Approximate Bayesian computation (ABC) methods can be used to evaluate posterior distributions without having to calculate likelihoods. In this paper, we discuss and apply an ABC method based on sequential Monte Carlo (SMC) to estimate parameters of dynamical models. We show that ABC SMC provides information about the inferability of parameters and model sensitivity to changes in parameters, and tends to perform better than other ABC approaches. The algorithm is applied to several well-known biological systems, for which parameters and their credible intervals are inferred. Moreover, we develop ABC SMC as a tool for model selection; given a range of different mathematical descriptions, ABC SMC is able to choose the best model using the standard Bayesian model selection apparatus.
Figures
Figure 1
(a) Trajectories of prey (solid curve) and predator (dashed curve) populations of the deterministic LV system and the data points (circles, prey data; triangles, predator data). (b) Parameters inferred by the ABC rejection sampler.
Figure 2
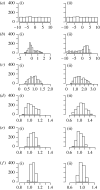
Histograms of populations (a) 0 (uniform prior distribution), (b) 1, (c) 2, (d) 3, (e) 4 and (f) 5 (approximation of posterior distribution) of parameters (i) a and (ii) b of the LV system.
Figure 3
Histograms of the approximated posterior distributions of parameters (a) _c_1, (b) _c_2 and (c) _c_3 of the stochastic LV dynamics.
Figure 4
(a) Histograms of the approximate marginal posterior distributions of parameters _α_0, n, β and α of the deterministic repressilator model. (b) The normalized 95% interquantile ranges (qr) of each population. The narrower the interval for a given tolerance ϵ t, the more sensitive the model is to the corresponding parameter. The interquantile range reached in population 9 is determined by the added experimental noise. As _ϵ_9 was chosen accordingly, one cannot proceed by lowering the tolerance further. The sharp change in the interquantile ranges, which occurs, for example, for parameter _α_0 between populations 1 and 2, can be explained by the steep gradient of the likelihood surface along _α_0. (c) The output (i.e. the accepted particles) of the ABC SMC algorithm as two-dimensional scatterplots. The particles from population 1 are in yellow, particles from population 4 in black, particles from population 7 in blue and those from the last population in red. Islands of particles are observed in population 4 and they can be explained by the multimodality of the fourth intermediate distribution. (d) PCA of the set of accepted particles (population 9). Owing to the dependence of the PCA on the scaling of original variables, the PCA was performed on the correlation matrix. The first PC explains 70.0% of the total variance, the second 24.6%, the third 5.3% and the fourth 0.1% of the variance. Pie charts show the fraction of the length of PCs explained by individual parameters.
Figure 5
(a) Histograms of the approximated posterior distributions of parameters _α_0, n, β and α of the stochastic repressilator model. (b) The output of the ABC SMC algorithm as two-dimensional scatterplots. The particles from population 1 are in yellow, particles from population 2 in black, particles from population 3 in blue and those from the last population in red. We note that the projection to parameter n in population 2 is a sample from a multimodal intermediate distribution, while this distribution becomes unimodal from population 3 onwards.
Figure 6
Histograms show populations (a_–_i) 1–9 of the model parameter m. Population 9 represents the final posterior marginal estimate of m. Population 0 (discrete uniform prior distribution) is not shown.
Figure 7
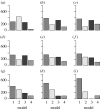
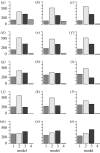
Populations of the marginal posterior distribution of m. Models 1–4 correspond to equations (3.10)–(3.13), respectively. An interesting phenomenon is observed in populations 1–12, where model 2 has the highest probability, in contrast to model 3 having the highest inferred probability in the last population. The most probable explanation for this is that a local maximum favouring model 2 has been passed on route to a global maximum of the posterior probability favouring model 3. Populations (a_–_o) 1–15. Population 0 (discrete uniform prior distribution) is not shown.
Figure 8
Histograms of the approximated posterior distributions of parameters (a) γ, (b) v, (c) δ and (d) S(0) of the SIR model with a latent phase of infection (3.12).
Figure 9
(a) The probability density function of a mixture of two normal distributions, (1/2)ϕ(0,1/100)+(1/2)ϕ(0,1), taken as a toy example used for a comparison of ABC SMC with ABC PRC. (b,c) Plots show how the variance of approximated intermediate distributions π t changes with populations (_t_=1, …, 10 on the _x_-axis). The red curves plot the variance of the ABC SMC population and the blue curves the variance of the non-weighted ABC PRC populations. The perturbation kernel in both algorithms is uniform, Kt=σU(−1,1). In (b), _σ_=1.5 and this results in poor estimation of the posterior variance with the ABC PRC algorithm. In (c), σ is updated in each population so that it expands over the whole population range. Such σ is big enough for non-weighted ABC PRC to perform equally well as ABC SMC.
Similar articles
- Bayesian parameter inference and model selection by population annealing in systems biology.
Murakami Y. Murakami Y. PLoS One. 2014 Aug 4;9(8):e104057. doi: 10.1371/journal.pone.0104057. eCollection 2014. PLoS One. 2014. PMID: 25089832 Free PMC article. - Alive SMC(2) : Bayesian model selection for low-count time series models with intractable likelihoods.
Drovandi CC, McCutchan RA. Drovandi CC, et al. Biometrics. 2016 Jun;72(2):344-53. doi: 10.1111/biom.12449. Epub 2015 Nov 19. Biometrics. 2016. PMID: 26584211 - A comparison of Monte Carlo-based Bayesian parameter estimation methods for stochastic models of genetic networks.
Mariño IP, Zaikin A, Míguez J. Mariño IP, et al. PLoS One. 2017 Aug 10;12(8):e0182015. doi: 10.1371/journal.pone.0182015. eCollection 2017. PLoS One. 2017. PMID: 28797087 Free PMC article. - ABC as a flexible framework to estimate demography over space and time: some cons, many pros.
Bertorelle G, Benazzo A, Mona S. Bertorelle G, et al. Mol Ecol. 2010 Jul;19(13):2609-25. doi: 10.1111/j.1365-294X.2010.04690.x. Epub 2010 Jun 18. Mol Ecol. 2010. PMID: 20561199 Review. - On the use of kernel approximate Bayesian computation to infer population history.
Nakagome S. Nakagome S. Genes Genet Syst. 2015;90(3):153-62. doi: 10.1266/ggs.90.153. Genes Genet Syst. 2015. PMID: 26510570 Review.
Cited by
- Contact tracing evaluation for COVID-19 transmission in the different movement levels of a rural college town in the USA.
Moon SA, Scoglio CM. Moon SA, et al. Sci Rep. 2021 Mar 1;11(1):4891. doi: 10.1038/s41598-021-83722-y. Sci Rep. 2021. PMID: 33649364 Free PMC article. - An integrated strategy for prediction uncertainty analysis.
Vanlier J, Tiemann CA, Hilbers PA, van Riel NA. Vanlier J, et al. Bioinformatics. 2012 Apr 15;28(8):1130-5. doi: 10.1093/bioinformatics/bts088. Epub 2012 Feb 21. Bioinformatics. 2012. PMID: 22355081 Free PMC article. - Using mechanistic model-based inference to understand and project epidemic dynamics with time-varying contact and vaccination rates.
Plank MJ, Hendy SC, Binny RN, Vattiato G, Lustig A, Maclaren OJ. Plank MJ, et al. Sci Rep. 2022 Nov 28;12(1):20451. doi: 10.1038/s41598-022-25018-3. Sci Rep. 2022. PMID: 36443439 Free PMC article. - Generalized method of moments for estimating parameters of stochastic reaction networks.
Lück A, Wolf V. Lück A, et al. BMC Syst Biol. 2016 Oct 21;10(1):98. doi: 10.1186/s12918-016-0342-8. BMC Syst Biol. 2016. PMID: 27769280 Free PMC article. - Simple epidemiological dynamics explain phylogenetic clustering of HIV from patients with recent infection.
Volz EM, Koopman JS, Ward MJ, Brown AL, Frost SD. Volz EM, et al. PLoS Comput Biol. 2012;8(6):e1002552. doi: 10.1371/journal.pcbi.1002552. Epub 2012 Jun 28. PLoS Comput Biol. 2012. PMID: 22761556 Free PMC article.
References
- Anderson R.M., May R.M. Oxford University Press; New York, NY: 1991. Infectious diseases of humans: dynamics and control.
- Baker C., Bocharov G., Ford J., Lumb P.S.J., Norton C.A.H., Paul T., Junt P., Krebs B. Ludewig computational approaches to parameter estimation and model selection in immunology. J. Comput. Appl. Math. 2005;184:50–76. doi: 10.1016/j.cam.2005.02.003. - DOI
- Banks H., Grove S., Hu S., Ma Y. A hierarchical Bayesian approach for parameter estimation in HIV models. Inverse Problems. 2005;21:1803–1822. doi: 10.1088/0266-5611/21/6/001. - DOI
- Beaumont, M. 2008a Simulations, genetics and human prehistory (eds S. Matsumura, P. Forester & C. Renfrew). McDonald Institute Monographs, University of Cambridge.
Publication types
MeSH terms
LinkOut - more resources
Full Text Sources
Other Literature Sources


