Arabidopsis CaM binding protein CBP60g contributes to MAMP-induced SA accumulation and is involved in disease resistance against Pseudomonas syringae - PubMed (original) (raw)
Arabidopsis CaM binding protein CBP60g contributes to MAMP-induced SA accumulation and is involved in disease resistance against Pseudomonas syringae
Lin Wang et al. PLoS Pathog. 2009 Feb.
Abstract
Salicylic acid (SA)-induced defense responses are important factors during effector triggered immunity and microbe-associated molecular pattern (MAMP)-induced immunity in plants. This article presents evidence that a member of the Arabidopsis CBP60 gene family, CBP60g, contributes to MAMP-triggered SA accumulation. CBP60g is inducible by both pathogen and MAMP treatments. Pseudomonas syringae growth is enhanced in cbp60g mutants. Expression profiles of a cbp60g mutant after MAMP treatment are similar to those of sid2 and pad4, suggesting a defect in SA signaling. Accordingly, cbp60g mutants accumulate less SA when treated with the MAMP flg22 or a P. syringae hrcC strain that activates MAMP signaling. MAMP-induced production of reactive oxygen species and callose deposition are unaffected in cbp60g mutants. CBP60g is a calmodulin-binding protein with a calmodulin-binding domain located near the N-terminus. Calmodulin binding is dependent on Ca(2+). Mutations in CBP60g that abolish calmodulin binding prevent complementation of the SA production and bacterial growth defects of cbp60g mutants, indicating that calmodulin binding is essential for the function of CBP60g in defense signaling. These studies show that CBP60g constitutes a Ca(2+) link between MAMP recognition and SA accumulation that is important for resistance to P. syringae.
Conflict of interest statement
The authors have declared that no competing interests exist.
Figures
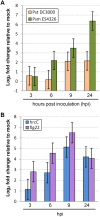
Figure 1. Changes in CBP60g expression levels after pathogen or MAMP inoculation.
Each bar represents the log2 ratio of the mean expression value in treated plants relative to mock-treated plants. Data were normalized using the control gene ACTIN2. Data were obtained in three independent experiments, each with two technical replicates, and analyzed by ANOVA. Error bars represent standard error. (A) CBP60g expression in response to inoculation with Psm ES4326 or Pst DC3000 inoculation. (B) CBP60g expression in response to Pst DC3000 hrcC or flg22 inoculation.
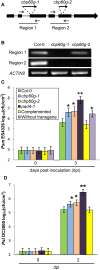
Figure 2. Mutants of CBP60g support more bacterial growth than wild-type plants.
(A) Illustration of CBP60g mutants cbp60g-1 and cpb60g-2. Bold lines, exons; thin lines, introns; bold arrows: T-DNA insertions; thin arrows, primers used for RT-PCR. (B) RT-PCR results showing two regions of the CBP60g transcript. (C) Bacterial growth assays using Psm ES4326. Each bar at 0 hours or 72 hours represents data from 4 or at least 16 replicates, respectively. Error bars represent standard deviation from 16 samples. Asterisks, p<0.05. P values were calculated using the two-tailed Mann-Whitney U-test. Similar results for the cbp60g mutants were obtained in two other independent experiments. Complemented, cbp60g-1 plants carrying wild-type CBP60g as a transgene; Without transgene; siblings of the complemented plants lacking the transgene.
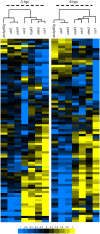
Figure 3. Expression patterns identified by agglomerative hierarchical clustering.
The log2 ratios of each indicated sample comparison were used for the analysis. Clustering was separately performed at each time point with Cluster using the uncentered Pearson correlation and complete linkage clustering. Results were visualized with Treeview . Blue indicates negative values, yellow positive values and black zero, as shown on the color scale at the bottom of the figure.
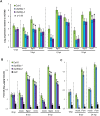
Figure 4. SID2 expression and SA accumulation in cbp60g mutants.
(A) SID2 expression in Col-0 and cbp60g mutants after flg22 or Pst DC3000 hrcC (hrcC) treatment. Each bar represents the log2 expression value relative to ACTIN2. Data was obtained in three independent experiments, each with two technical replicates, analyzed by ANOVA. Error bars represent standard error. (B) Measurement of free SA after flg22 or Pst DC3000 hrcC treatments. (C) Measurement of free SA after Psm ES4326 treatment. For B and C, data from two independent experiments, each consisting of one sample of each type, was analyzed by ANOVA. Error bars represent standard error.
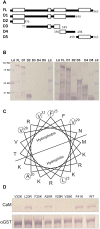
Figure 5. Mapping and site-directed mutagenesis of the CBP60g CaM-binding domain.
(A) Illustration of wild-type and deletion constructs of CBP60g protein sequences. FL, full-length wild-type protein; D1 to D5, five deletion constructs. Empty white bars, predicted coiled-coil domains; dark solid bars, non-coiled coil domains. Numbers indicate amino acid positions in the full-length protein. (B) CaM binding by GST-tagged CBP60 deletion constructs. Left, detection of CaM biding; right, detection of GST; Ld, protein size marker ladder. The predicted protein sizes of GST-fusion deletion constructs for FL, D1, D2, D3, D4, and D5 are 92.3 KD, 89.1 KD, 37.6 KD, 63.1 KD, 48.1KD, and 35.8 KD respectively. (C) Helical wheel projection of the CBP60g CaM-binding domain. Amino acids selected for mutagenesis are circled. (D) CaM binding assay of mutated GST-tagged CBP60g proteins. Upper picture, CaM binding; lower picture, detection of GST.
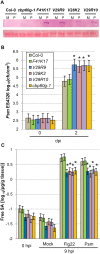
Figure 6. Measurement of bacterial growth and free SA in cbp60g transgenic lines.
(A) Presence of modified CBP60g proteins in the cbp60g-1 background. Upper panel shows the immunoblot results using anti-c-Myc antibody; lower panel shows the large subunit of the Ribulose-1,5-bisphosphate carboxylase/oxygenase (Rubisco) stained with Ponceau S as a measurement of the total protein loaded onto each lane. M indicates mock treated, P indicates Psm ES4326 treated. (B) Bacterial growth assays using Psm ES4326. Each bar at 0 and 48 hours represents 4 or 16 replicates, respectively. Error bars represent standard deviation. P values were calculated using two-tailed Mann-Whitney U-test. Asterisks indicate p<0.05. (C) Measurement of free-SA after flg22 and Psm ES4326 treatment. Data were pooled from two independent experiments. Samples were extracted from six leaves for each genotype in each replicate. Error bars represent standard error calculated by ANOVA. Asterisks indicate p<0.01.
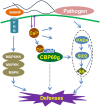
Figure 7. Model of CBP60g function in defense signaling.
Binding of MAMPs by pattern recognition receptors initiates a MAPK signaling cascade that leads to activation of defense gene expression through WRKY transcription factors. MAMP recognition also induces production of reactive oxygen species by AtRBOHD, callose deposition, cytosolic Ca2+ flux, and CBP60g expression. CBP60g, when activated by CaM binding, positively regulates signaling leading to SA accumulation and defense gene expression.
Similar articles
- The CALMODULIN-BINDING PROTEIN60 family includes both negative and positive regulators of plant immunity.
Truman W, Sreekanta S, Lu Y, Bethke G, Tsuda K, Katagiri F, Glazebrook J. Truman W, et al. Plant Physiol. 2013 Dec;163(4):1741-51. doi: 10.1104/pp.113.227108. Epub 2013 Oct 17. Plant Physiol. 2013. PMID: 24134885 Free PMC article. - CBP60g and SARD1 play partially redundant critical roles in salicylic acid signaling.
Wang L, Tsuda K, Truman W, Sato M, Nguyen le V, Katagiri F, Glazebrook J. Wang L, et al. Plant J. 2011 Sep;67(6):1029-41. doi: 10.1111/j.1365-313X.2011.04655.x. Epub 2011 Jul 6. Plant J. 2011. PMID: 21615571 - Interplay between MAMP-triggered and SA-mediated defense responses.
Tsuda K, Sato M, Glazebrook J, Cohen JD, Katagiri F. Tsuda K, et al. Plant J. 2008 Mar;53(5):763-75. doi: 10.1111/j.1365-313X.2007.03369.x. Epub 2007 Nov 14. Plant J. 2008. PMID: 18005228 - Responses of Arabidopsis thaliana to challenge by Pseudomonas syringae.
Kim MG, Kim SY, Kim WY, Mackey D, Lee SY. Kim MG, et al. Mol Cells. 2008 May 31;25(3):323-31. Epub 2008 May 16. Mol Cells. 2008. PMID: 18483469 Review. - Biosynthesis of salicylic acid in plants.
Chen Z, Zheng Z, Huang J, Lai Z, Fan B. Chen Z, et al. Plant Signal Behav. 2009 Jun;4(6):493-6. doi: 10.4161/psb.4.6.8392. Epub 2009 Jun 12. Plant Signal Behav. 2009. PMID: 19816125 Free PMC article. Review.
Cited by
- Salicylic acid-independent role of NPR1 is required for protection from proteotoxic stress in the plant endoplasmic reticulum.
Lai YS, Renna L, Yarema J, Ruberti C, He SY, Brandizzi F. Lai YS, et al. Proc Natl Acad Sci U S A. 2018 May 29;115(22):E5203-E5212. doi: 10.1073/pnas.1802254115. Epub 2018 May 14. Proc Natl Acad Sci U S A. 2018. PMID: 29760094 Free PMC article. - PRR2, a pseudo-response regulator, promotes salicylic acid and camalexin accumulation during plant immunity.
Cheval C, Perez M, Leba LJ, Ranty B, Perochon A, Reichelt M, Mithöfer A, Robe E, Mazars C, Galaud JP, Aldon D. Cheval C, et al. Sci Rep. 2017 Aug 1;7(1):6979. doi: 10.1038/s41598-017-07535-8. Sci Rep. 2017. PMID: 28765536 Free PMC article. - Molecular innovations in plant TIR-based immunity signaling.
Lapin D, Johanndrees O, Wu Z, Li X, Parker JE. Lapin D, et al. Plant Cell. 2022 Apr 26;34(5):1479-1496. doi: 10.1093/plcell/koac035. Plant Cell. 2022. PMID: 35143666 Free PMC article. Review. - The CALMODULIN-BINDING PROTEIN60 family includes both negative and positive regulators of plant immunity.
Truman W, Sreekanta S, Lu Y, Bethke G, Tsuda K, Katagiri F, Glazebrook J. Truman W, et al. Plant Physiol. 2013 Dec;163(4):1741-51. doi: 10.1104/pp.113.227108. Epub 2013 Oct 17. Plant Physiol. 2013. PMID: 24134885 Free PMC article. - SlCNGC1 and SlCNGC14 Suppress Xanthomonas oryzae pv. _oryzicola_-Induced Hypersensitive Response and Non-host Resistance in Tomato.
Zhang XR, Xu YP, Cai XZ. Zhang XR, et al. Front Plant Sci. 2018 Mar 6;9:285. doi: 10.3389/fpls.2018.00285. eCollection 2018. Front Plant Sci. 2018. PMID: 29559989 Free PMC article.
References
- Osbourn A, He SY. Biotic interactions: towards a unifying and balanced view. Curr Opin Plant Biol. 2006;9:347–350. - PubMed
- He P, Shan L, Sheen J. Elicitation and suppression of microbe-associated molecular pattern-triggered immunity in plant-microbe interactions. Cell Microbiol. 2007;9:1385–1396. - PubMed
- Jones JD, Dangl JL. The plant immune system. Nature. 2006;444:323–329. - PubMed
- Zipfel C, Kunze G, Chinchilla D, Caniard A, Jones JD, et al. Perception of the bacterial PAMP EF-Tu by the receptor EFR restricts Agrobacterium-mediated transformation. Cell. 2006;125:749–760. - PubMed
Publication types
MeSH terms
Substances
LinkOut - more resources
Full Text Sources
Molecular Biology Databases
Miscellaneous
