Mechanisms of sleep-dependent consolidation of cortical plasticity - PubMed (original) (raw)
Mechanisms of sleep-dependent consolidation of cortical plasticity
Sara J Aton et al. Neuron. 2009.
Abstract
Sleep is thought to consolidate changes in synaptic strength, but the underlying mechanisms are unknown. We investigated the cellular events involved in this process during ocular dominance plasticity (ODP)-a canonical form of in vivo cortical plasticity triggered by monocular deprivation (MD) and consolidated by sleep via undetermined, activity-dependent mechanisms. We find that sleep consolidates ODP primarily by strengthening cortical responses to nondeprived eye stimulation. Consolidation is inhibited by reversible, intracortical antagonism of NMDA receptors (NMDARs) or cAMP-dependent protein kinase (PKA) during post-MD sleep. Consolidation is also associated with sleep-dependent increases in the activity of remodeling neurons and in the phosphorylation of proteins required for potentiation of glutamatergic synapses. These findings demonstrate that synaptic strengthening via NMDAR and PKA activity is a key step in sleep-dependent consolidation of ODP.
Figures
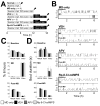
Fig. 1. Sleep data for main experimental groups
(A) Experimental design. n = number of animals per group. Arrowheads indicate time at which measurements of OD were made. (B) Hypnograms showing waking (W), REM sleep (R), and NREM sleep (N) for representative MD-only, VEH, APV, and Rp-8-Cl-cAMPS cats are shown for each phase of the experiment. Relative amounts (expressed as % of total recording time; mean ± SEM shown in C) and mean ± SEM bout durations in seconds (s) (shown in D) for these vigilance states did not differ between the three groups during baseline or MD, or between the two sleeping groups during the post-MD recording period (N.S. for all measures, one-way ANOVA with Student-Newman-Keuls [SNK] post hoc test).
Fig. 2. Sleep-dependent consolidation of ODP is disrupted by NMDAR and PKA antagonism: intrinsic signal imaging
(A) Representative visual response maps of V1 contralateral to the right (or deprived: DE) eye (i.e., left hemisphere) are shown for a normally-sighted critical period cat (Normal), a MD-only cat, and cats infused with VEH, APV or Rp-8-Cl-cAMPS during post-MD sleep. For infusions, maps are shown in areas near (< 3 mm from) the infusion cannula site. n = number of imaged hemispheres in each condition. From left to right are vascular maps (highlighted areas indicate optimally-focused, vascular artifact-free areas used for analysis), angle maps produced for left eye (NDE) stimulation, and angle maps produced for right eye (DE) stimulation. In angle maps, the hue indicates the preferred stimulus orientation at each pixel (see inset key). White scale bars in vascular maps = 1 mm. (B) Pixel-by-pixel OD histograms were computed for each map by comparing the relative NDE and DE response magnitudes at each imaged pixel. The pixel distribution was collapsed into a classic 7-point OD measurement scale (Hubel and Wiesel, 1970) as described (Jha et al., 2005). Values to the right are the corresponding NBI and MI scores for each map. (C–E) Quantitative measurements of OD. One-way ANOVA showed significant main effects of treatment group for SIs (F = 10.8, p < 0.001), NBIs (NBIboth hemispheres: F = 10.0, p < 0.001, NBIright hemisphere: F = 4.1, p = 0.017; NBIleft hemisphere: F = 6.1, p = 0.003), and MI measures (MIboth hemispheres: F = 11.4, p < 0.001, MIright hemisphere: F = 6.4, p = 0.003; MIleft hemisphere: F = 5.3, p = 0.006). SIs (mean ± SEM shown in C) were significantly increased following waking MD alone (* indicates p < 0.05 vs. Normal V1, SNK post hoc test), but were increased further by subsequent sleep (# indicates p < 0.05 vs. MD-only V1). SIs were similar to Normal V1 in areas near sites where APV or Rp-8-Cl-cAMPS was infused during post-MD sleep. NBIs (mean ± SEM shown in D) and MIs (mean ± SEM shown in E) were similarly affected by waking MD, subsequent sleep, and drug infusion. Effects were similar when right- and left-hemisphere measurements were combined (black bars in D and E), or compared separately (red and green bars, respectively). Black lines indicate mean combined hemisphere values for Normal V1; * indicates p < 0.05 vs. same-hemisphere measurements from Normal V1, SNK post hoc test; # indicates p < 0.05 vs. same-hemisphere measurements from MD-only V1. For SI and NBI measures, a value of 1 indicates complete dominance by the NDE. For MI measures, a value of 1 indicates complete loss of binocularity.
Fig. 3. Sleep-dependent consolidation of ODP is disrupted by NMDAR and PKA antagonism: micro-electrode recordings
(A) OD histograms for single neurons recorded from both hemispheres (TOTAL) and in hemispheres ipsilateral (IPSI) and contralateral (CONTRA) to the DE are shown for the main groups. OD scores were ranked on a 7-point scale as described previously (Jha et al., 2005). n = number of neurons recorded in each condition. Quantitative measurements of OD in both hemispheres are shown in B–D. One-way ANOVA showed a significant effect of treatment for SI (F = 5.1, p = 0.006), NBI (NBIboth hemispheres: F = 4.1, p = 0.006, NBIright hemisphere: F = 4.3, p = 0.011, NBIleft hemisphere: N.S.), and MI measures (MIboth hemispheres: F = 8.9, p < 0.001, MIright hemisphere: F = 6.2, p = 0.002, MIleft hemisphere: F = 5.1, p = 0.005). SIs (mean ± SEM shown in B) were not significantly increased following MD alone (N.S. vs. Normal V1, SNK post hoc test), but were greater in VEH-infused animals following post-MD sleep (* indicates p < 0.05 vs. Normal, SNK test). Effects of sleep on SI were blocked near sites of APV or Rp-8-Cl-cAMPS infusion. Similarly, NBIs (mean ± SEM shown in C) for neurons in MD-only animals and near APV or Rp-8-Cl-cAMPS infusion cannulae did not differ from Normal hemispheres, while neurons from VEH-infused animals showed a significant increase in NBI (* indicates p < 0.05 vs. same-hemisphere measurements from Normal V1, SNK test). MIs (mean ± SEM shown in D) were increased following MD alone, as well as after post-MD sleep (* indicates p < 0.05 vs. same-hemisphere measurements from Normal V1, SNK test). For C and D, black horizontal lines indicate mean combined hemisphere values for Normal V1.
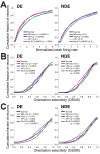
Fig. 4. Post-MD sleep leads to specific augmentation of non-deprived eye (NDE) responses
(A) Cumulative distributions of normalized peak firing rates to stimulation of the right eye (DE) and left eye (NDE) at each neuron’s preferred orientation. Firing rates were decreased following MD alone (vs. Normal V1, Kolmogorov-Smirnov [K-S] test; p values shown) for the right eye (DE) and unchanged for the left eye (NDE). Following post-MD sleep, NDE firing rates were significantly augmented. APV and Rp-8-Cl-cAMPS infusion during post-MD sleep inhibited NDE augmentation, and APV also reversed DE depression (B–C). Cumulative distributions for two measures of orientation selectivity (OSI45 and OSI90) for DE and NDE responses. Both measures showed similar effects of MD and subsequent sleep - MD alone produced lower DE OSI values; post-MD sleep produced higher NDE OSI values. APV and Rp-8-Cl-cAMPS infusion both decreased orientation selectivity in both eyes (C), but this was more pronounced following Rp-8-Cl-cAMPS infusion (B).
Fig. 5. LTP-like changes in protein phosphorylation are seen in V1 during early post-MD sleep
(A) Experimental design. For details see Results and Experimental Procedures sections. n = number of hemispheres per group. (B) Representative Western blots of left-hemisphere V1 protein samples from the main groups run side-by-side, showing levels of phosphorylated ERK, CaMKII, and GluR1 with β-actin loading control. (C) Quantification of phosphorylated/total levels of each protein for the main groups. Intensity data for each sample within individual blots were normalized to mean levels for Normal control samples run concurrently. This allowed for comparisons of intensity values across multiple blots; values are thus expressed as fold change over Normal (mean ± SEM). Significant effects of treatment on phosphorylation levels were found for ERK (H = 29.5, p = 0.001, Kruskal-Wallis ANOVA), CaMKIIα and β (H = 16.9, p < 0.05 and H = 20.0, p < 0.005, respectively), and GluR1 (H = 26.7, p < 0.001 for pSer831 and H = 17.7, p < 0.01 for pSer845). Relative to MD alone (MD-only), phophorylated ERK, CaMKII, and GluR1 (at Ser831, the site phosphorylated by CaMKII) were significantly higher after 1–2 h of post-MD sleep (MD+1&2S; * indicates p < 0.05, Dunn’s post hoc test); these changes did not occur in animals that were sleep deprived following MD (MD+2SD) or had APV infused into V1 during the post-MD sleep period (MD+2S+APV). These increases in phosphorylation were sleep-dependent (MD+1&2S vs. MD+SD) and transient (MD+1&2S vs. MD+6S). However, phosphorylation of GluR1 at Ser845 (PKA site) was significantly increased after 6 h of post-MD sleep (relative to Normal V1, * indicates p < 0.05, Dunn’s post hoc test).
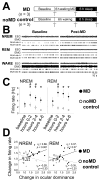
Fig. 6. Remodeling neurons show increased firing rate during early post-MD sleep
(A) Longitudinal V1 multi-unit recordings were made in cats before, during and after MD and in control cats that underwent the same procedures without MD. Changes in OD were made during periodic assessments (time indicated by arrows). n = number of cats per group (B) Raster plots showing MUA from representative V1 sites during baseline recording (left) and post-MD sleep (right). Mean firing rates during the first 2 to 4 h of post-MD NREM and REM sleep (black filled circles, C) were significantly increased relative to baseline (main effect of time for NREM: χ2 = 31.7, p < 0.001; for REM: χ2 = 19.6, p < 0.001, Friedman’s repeated measures ANOVA on ranks; # indicates p < 0.05 vs. baseline, SNK post hoc test). In contrast, firing rates during sleep for control (noMD, open circles) animals did not change relative to baseline (repeated measures ANOVA on ranks, N.S.), and were significantly lower (relative to animals receiving MD) during ad lib sleep (two-way ANOVA for effects of treatment × time, main effect of treatment, p < 0.001 for both REM and NREM, * indicates p < 0.05 vs. MD condition, SNK test). On a site-by-site basis, changes in normalized firing rates during NREM from baseline to post-MD sleep (D) were positively correlated in MD cats with changes in OD following post-MD sleep (rs and _p_-values shown, black line, filled circles, Spearman rank order correlation test). There was a similar positive relationship between REM firing rate changes and OD changes, but this did not reach statistical significance. In noMD cats, there were no significant correlations in these parameters (rs and _p_-values shown, gray line, open circles; Spearman rank order correlation test).
Similar articles
- Extracellular signal-regulated kinase (ERK) activity during sleep consolidates cortical plasticity in vivo.
Dumoulin MC, Aton SJ, Watson AJ, Renouard L, Coleman T, Frank MG. Dumoulin MC, et al. Cereb Cortex. 2015 Feb;25(2):507-15. doi: 10.1093/cercor/bht250. Epub 2013 Sep 17. Cereb Cortex. 2015. PMID: 24047601 Free PMC article. - The role of NMDA glutamate receptors, PKA, MAPK, and CAMKII in the hippocampus in extinction of conditioned fear.
Szapiro G, Vianna MR, McGaugh JL, Medina JH, Izquierdo I. Szapiro G, et al. Hippocampus. 2003;13(1):53-8. doi: 10.1002/hipo.10043. Hippocampus. 2003. PMID: 12625457 - Creation of AMPA-silent synapses in the neonatal hippocampus.
Xiao MY, Wasling P, Hanse E, Gustafsson B. Xiao MY, et al. Nat Neurosci. 2004 Mar;7(3):236-43. doi: 10.1038/nn1196. Epub 2004 Feb 15. Nat Neurosci. 2004. PMID: 14966524 - Sleep on it: cortical reorganization after-the-fact.
Hoffman KL, McNaughton BL. Hoffman KL, et al. Trends Neurosci. 2002 Jan;25(1):1-2. doi: 10.1016/s0166-2236(00)02005-1. Trends Neurosci. 2002. PMID: 11801320 Review. - Regulation of neuronal PKA signaling through AKAP targeting dynamics.
Dell'Acqua ML, Smith KE, Gorski JA, Horne EA, Gibson ES, Gomez LL. Dell'Acqua ML, et al. Eur J Cell Biol. 2006 Jul;85(7):627-33. doi: 10.1016/j.ejcb.2006.01.010. Epub 2006 Feb 28. Eur J Cell Biol. 2006. PMID: 16504338 Review.
Cited by
- About sleep's role in memory.
Rasch B, Born J. Rasch B, et al. Physiol Rev. 2013 Apr;93(2):681-766. doi: 10.1152/physrev.00032.2012. Physiol Rev. 2013. PMID: 23589831 Free PMC article. Review. - Acute disruption of the NMDA receptor subunit NR1 in the honeybee brain selectively impairs memory formation.
Müssig L, Richlitzki A, Rössler R, Eisenhardt D, Menzel R, Leboulle G. Müssig L, et al. J Neurosci. 2010 Jun 9;30(23):7817-25. doi: 10.1523/JNEUROSCI.5543-09.2010. J Neurosci. 2010. PMID: 20534830 Free PMC article. - A sleep-active basalocortical pathway crucial for generation and maintenance of chronic pain.
Zhou H, Li M, Zhao R, Sun L, Yang G. Zhou H, et al. Nat Neurosci. 2023 Mar;26(3):458-469. doi: 10.1038/s41593-022-01250-y. Epub 2023 Jan 23. Nat Neurosci. 2023. PMID: 36690899 Free PMC article. - Molecular Mechanisms of Memory Consolidation That Operate During Sleep.
Reyes-Resina I, Samer S, Kreutz MR, Oelschlegel AM. Reyes-Resina I, et al. Front Mol Neurosci. 2021 Nov 18;14:767384. doi: 10.3389/fnmol.2021.767384. eCollection 2021. Front Mol Neurosci. 2021. PMID: 34867190 Free PMC article. Review.
References
- Albensi BC, Oliver DR, Toupin J, Odero G. Electrical stimulation protocols for hippocampal synaptic plasticity and neuronal hyper-excitability: Are they effective or relevant? Experimental Neurology. 2007;204:1–13. - PubMed
- Beaver CJ, Fischer QS, Ji Q, Daw NW. Orientation selectivity is reduced by monocular deprivation in combination with PKA inhibitors. J Neurophysiol. 2002;88:1933–1940. - PubMed
- Beaver CJ, Ji QJ, Fischer QS, Daw NW. Cyclic AMP-dependent protein kinase mediated ocular dominance shifts in cat visual cortex. Nat Neurosci. 2001;4:159–163. - PubMed
- Berardi N, Pizzorusso T, Ratto GM, Maffei L. Molecular basis of plasticity in the visual cortex. Trends in Neurosciences. 2003;26:369–378. - PubMed
Publication types
MeSH terms
Substances
Grants and funding
- R01 EY019022/EY/NEI NIH HHS/United States
- F32 EY017766-01A1/EY/NEI NIH HHS/United States
- F32 EY017766/EY/NEI NIH HHS/United States
- F32 EY017766-02/EY/NEI NIH HHS/United States
- F32 EY017766-03/EY/NEI NIH HHS/United States
- F32 EY006831-03/EY/NEI NIH HHS/United States
- F32 EY006831/EY/NEI NIH HHS/United States
- R01 EY019022-01/EY/NEI NIH HHS/United States
LinkOut - more resources
Full Text Sources
Molecular Biology Databases


