Increased PDGFRalpha activation disrupts connective tissue development and drives systemic fibrosis - PubMed (original) (raw)
Increased PDGFRalpha activation disrupts connective tissue development and drives systemic fibrosis
Lorin E Olson et al. Dev Cell. 2009 Feb.
Abstract
PDGF signaling regulates the development of mesenchymal cell types in the embryo and in the adult, but the role of receptor activation in tissue homeostasis has not been investigated. We have generated conditional knockin mice with mutations in PDGFRalpha that drive increased kinase activity under the control of the endogenous PDGFRalpha promoter. In embryos, increased PDGFRalpha signaling leads to hyperplasia of stromal fibroblasts, which disturbs normal smooth muscle tissue in radially patterned organs. In adult mice, elevated PDGFRalpha signaling also increases connective tissue growth, leading to a progressive fibrosis phenotype in multiple organs. Increased PDGFRalpha signaling in an Ink4a/Arf-deficient genetic background leads to accelerated fibrosis, suggesting a new role for tumor suppressors in attenuating fibrotic diseases. These results highlight the role of PDGFRalpha in normal connective tissue development and homeostasis and demonstrate a pivotal role for PDGFRalpha signaling in systemic fibrosis diseases.
Figures
Figure 1. Constitutive and Inducible Signaling by PDGFRα Mutant cDNA Knockins
(A) Schematic of the PDGFRα cDNA knockin vector and the wild type PDGFRα genomic locus. Open triangles indicate loxP sites. Vertical rectangles on the lower, genomic schematic indicate approximate locations of exons 1 – 6, and horizontal rectangles underneath indicate the location of probes used for Southern blot. Note: the 5′ probe and Δstop Southern blots are shown in Figure S1. SA, splice acceptor; R1, EcoR1; N, Nhe1. (B) Schematic of two different PDGFRα mutants generated in this study. Shaded circles indicate amino acid changes in the juxtamembrane domain (αJ) or kinase domain (αK). (C) Southern blot analysis of wild type (+/+) and lox-stop-lox αK-targeted (+/(S)K) ES cell DNA digested with NheI. When probed with a 3′ external probe, the appearance of a novel fragment at 9kb indicates correct targeting of the locus. Fragments of 20kb and 12kb represent the wild type locus. Southern blot analysis of αJ clones was identical (not shown). (D) Western blot analysis of PDGFRα protein expression and phosphorylation in PDGFRα+/+ (Wt), PDGFRα+/J (αJ), and PDGFRα+/K (αK) embryos. Protein lysates from E13.5 embryos were subjected to immunopreciptitation (“IP”) with PDGFRα antibody, and blotted for phosphotyrosine. Separately, equal amounts of total protein were blotted for PDGFRα. (E–G) Primary mouse embryonic fibroblasts (MEFs) derived from PDGFRα+/+ (Wt), PDGFRα+/J (αJ), PDGFRα+/K (αK), or PDGFRα−/K (−/αK) embryos. Cells were serum starved, then harvested directly (−) or stimulated with 10ng/ml PDGF-AA (+). Protein lysates for PDGFRα analyses (E,F) were treated the same as in panel D, or were instead blotted for phosphorylated signaling proteins (G). Expression of total signaling proteins was the same in all samples by Western blot (not shown).
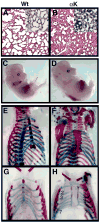
Figure 2. Phenotypic Analysis of PDGFRα+/K Embryos
(A,B) Hematoxylin and eosin staining of lung sections from E18.5 wild type (Wt) and PDGFRα+/K (αK) embryos. Inset: In situ hybridization for PDGFRα mRNA (blue stain) with individual labeled cells in wild type, or masses of cells in αK. (C,D) Whole embryos staged at E13.5. PDGFRα+/K embryos are enlarged with edema and pools of blood. (E,F) Skeletal preparations from E18.5 embryos. PDGFRα+/K skeletons exhibit a shortened and thickened sternum lacking the normal bands of residual cartilage (blue sternum components in E). (G,H) Skeletal preparations from E16.5 embryos. All seven pairs of wild type ribs make contact with the fused sternum bands, but several PDGFRα+/K ribs (numbered) do not contact or have poor contact with the unfused sternum bands. Atypical ossification correlates with poor rib-sternum contact.
Figure 3. Hyperplasia of Radially Patterned Gut and Ureter Mesenchyme in PDGFRα+/J and PDGFRα+/K Embryos
(A) Whole kidneys, ureters, and bladder isolated from a PDGFRα+/J survivor at postnatal day 28 (P28) with hydronephrosis. (B,C) Sagittal kidney sections from E17.5 wild type (Wt) and PDGFRα+/J (αJ) stained with hematoxylin and eosin, with hydronephrosis already apparent in PDGFRα+/J (asterisk). (D–F) Transverse sections of distal ureters from E18.5 wild type (Wt), PDGFRα+/J (αJ), or PDGFRα+/K (αK) embryos, with immunohistochemistry (IHC) for α-smooth muscle actin (brown). Smooth muscle appears as a single ring with flanking rings of blue stromal cells. Stromal components are hyperplastic in mutants (asterisks in E,F). (G,H) Ureters from P28 wild type and PDGFRα+/J pups stained with Masson’s trichrome. Differentiated stromal components (asterisks) produce collagen (blue stain) but in mutants the outer collagen ring extends beyond the microscope field. Fragmented urothelium in H is an artifact of tissue processing. (I–K) Transverse sections of esophagus from E18.5 wild type, PDGFRα+/J and PDGFRα+/K embryos with IHC for α-smooth muscle actin (brown). Asterisks = hyperplastic stroma.
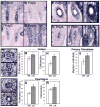
Figure 4. Mesenchymal Hyperplasia During Early Stages of Radially Patterned Organogenesis
(A–G) In situ hybridization for specific expressed genes in wild type ureters at E12.5 (A–D) and E14.5 (E–G). (A) Tbx18 probe identifies uretral mesenchyme at E12.5. (B,E) PDGFA is restricted to ureteric epithelium. (C,F) PDGFC is found in both epithelium and a concentric ring of uretral mesenchyme. (D,G) PDGFRα is broadly expressed in periuretral mesenchyme cells. (H–J) Expression of PDGF ligand and receptor probes in E12.5 esophagus, revealing a similar pattern to that seen in ureter. (K,L) Representative transverse sections of wild type and PDGFRα+/K ureter at E13.5, with BrdU+ cells labeled brown, negative cells labeled blue. White dashed lines show the epithelial-mesenchymal border. (M,N) Quantification of proliferating cells (M) and cell numbers per section (N) at E13.5 in the analyzed uretral mesenchyme (mean +/− standard deviation of >10 ureter sections per genotype). (O,P) Representative transverse sections of wild type and PDGFRα +/K esophagus at E13.5, with BrdU+ cells labeled brown, negative cells labeled blue. White dashed lines show the epithelial-mesenchymal border. (Q,R) Quantification of proliferating cells (Q) and cell numbers per section (R) at E13.5 in the analyzed esophageal mesenchyme (mean +/− standard deviation of 4 esophagus sections per genotype). (S) Migration of MEFs in a modified Boyden chamber assay towards 10ng/ml PDGF-AA. The number of migrated cells (mean number of cells per field +/−standard deviation) was counted in 13 fields of 20x magnification (total cells counted = 283 Wt, 425 αK). Data is representative of two independent assays performed in triplicate.
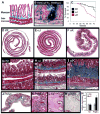
Figure 5. Gastrointestinal Fibrosis and Polyp Formation in Adult Mutants
(A) Schematic of gastrointestinal mucosa and submucosa. Epithelial surface of villi = pink, circular and longitudinal smooth muscle layers = red, connective tissue = blue. (B) Staining for β-galactosidase activity (blue) in a ROSA26CreER/RLacZ intestine. Activity is seen in individual cells of the submucosa and villus mesenchyme (arrows), and clones of epithelial cells (asterisk). (C) Kaplan-Meier survival plot of PDGFRα+/+;ROSA26+/CreER (Wt n=35); PDGFRα+/J;ROSA26+/CreER (αJ n=33); and PDGFRα+/K;ROSA26+/CreER (αK n=29) mice, beginning at the time of Tam treatment. Gastrointestinal dysfunction in PDGFRα+/K mice results in significantly diminished survival. (D–F) Swiss roll preparations of small intestine from Tam-treated cohort mice at 6–8 months after treatment. Submucosal thickening is seen in PDGFRα+/J and PDGFRα+/K, stained with hematoxylin and eosin. (G–I) Wild type, PDGFRα+/J and PDGFRα+/K small intestine stained with Masson’s trichrome (MT) to visualize increasing collagen (blue) in mutant tissue, and fibrotic invasion of the circular smooth muscle layer (asterisk in (I)). For purposes of orientation, brackets indicate mucosa (M) and submucosa (S). (J) Two fibrous polyps from a PDGFRα+/K small intestine, stained with MT. Collagen-rich polyp cores (blue) are surfaced with intact mucosa. (K) In situ hybridization for PDGFRα showing expression (blue) in many cells of the fibrous lesion. (L) In situ hybridization for Kit, which is largely absent within the lesion but is found in crypts. (M) Immunohistochemistry for α-SMA (brown), which is only expressed in nearby smooth muscle layers and residual muscularis mucosa. (N) Q-PCR shows increased expression of PDGFRα+/K but not Kit in fibrotic PDGFRα+/K intestine (mean +/− standard deviation).
Figure 6. Systemic Organ Fibrosis in Adult PDGFRα+/J and PDGFRα +/K Mice
All tissues were isolated from wild type (Wt), PDGFRα+/J (αJ) and PDGFRα(+/K) (αK) cohort mice at 6–8 months after Tam treatment. (A–C) Full thickness skin sections from Tam-treated cohort mice were stained with Masson’s trichrome (MT) to reveal collagen (blue). Major layers in wild type skin (A) are (top to bottom) epidermis (e), dermis (d), adipose (a, bracket), and muscle (m). Both mutants have increased collagen deposition associated with every layer (asterisks in B,C) except epidermis. (D,E) Sections of heart muscle stained with MT. Collagen (blue) associates with vessels in wild type (D) but infiltrates broadly in PDGFRα+/K heart muscle (arrows in E). (F,G) Lung tissue stained with MT. Wild type (F) has little collagen (blue) but fibrosis is seen in PDGFRα+/J (G) as deposits around the bronchioles (asterisk). (H,I) Skeletal muscle of the abdomen stained with MT. Collagen (blue) associates only with muscle fascia in wild type (H) but invades deep into mutant muscle (asterisks in I). (J) In situ hybridization for PDGFRα expression in fibrotic PDGFRα+/K skeletal muscle. Positive cells (blue) are found within the fibrotic lesion (asterisk). (K) Quantification of fibrosis based on tissue sections stained with picosirius red (mean of three animals per genotype +/− standard deviation). (L–N) IHC detection of phospho-PLCγ1 (brown) is sparse in wild type muscle fascia (L, red arrows) compared to abundant phospho-PLCγ1 (brown) in fibrotic PDGFRα+/K muscle fascia (M). Panel N: In situ hybridization for PDGFRα expression in an adjacent section of PDGFRα+/K muscle.
Figure 7. Loss of Ink4a/Arf Accelerates PDGFRα-driven Tumorigenesis and Fibrosis
(A) Kaplan-Meier survival plot of PDGFRα+/K;Ink4aArf_−/−;ROSA26+/CreER mice (n=40) versus Ink4aArf_−/−;ROSA26+/CreER littermates (n = 21). Mice were treated with Tam at E18.0 and the plot begins one day later (at birth). All PDGFRα+/K;Ink4aArf_−/− mutants developed sarcomas and fibrosis before 19 weeks with a mean tumor incidence at 14 weeks. (B) Ventral view of tumors on two PDGFRα+/K;Ink4aArf_−/−;ROSA26+/CreER mice at the time of necropsy, 14 weeks after Tam-treatment. (C) Representative sarcoma of the skin with strong expression of PDGFRα shown by in situ hybridization (blue). Intact epidermis covers the upper surface of the tumor. Hair follicle = hf. (D) The same tumor as (C) stained with Masson’s trichrome (MT) to show collagen (blue) in the normal dermis but not in the undifferentiated tumor cells (red). White spaces are enveloped adipocytes. (E) High power image of a representative sarcoma stained with hematoxylin and eosin. Nuclei are highly pleiomorphic with numerous mitotic figures. (F–I) Skin and abdominal muscle from cohort mice at 13 weeks after Tam-treatment: tissues were stained with MT to reveal collagen (blue). Loss of Ink4a/Arf synergizes with the αK mutation to dramatically accelerate the fibrosis of skin and muscle in double mutants (asterisks in panel I). Other genotypes have normal-appearing connective tissue at this time.
Similar articles
- PDGFRα plays a crucial role in connective tissue remodeling.
Horikawa S, Ishii Y, Hamashima T, Yamamoto S, Mori H, Fujimori T, Shen J, Inoue R, Nishizono H, Itoh H, Majima M, Abraham D, Miyawaki T, Sasahara M. Horikawa S, et al. Sci Rep. 2015 Dec 7;5:17948. doi: 10.1038/srep17948. Sci Rep. 2015. PMID: 26639755 Free PMC article. - Tissue-Resident PDGFRα+ Progenitor Cells Contribute to Fibrosis versus Healing in a Context- and Spatiotemporally Dependent Manner.
Santini MP, Malide D, Hoffman G, Pandey G, D'Escamard V, Nomura-Kitabayashi A, Rovira I, Kataoka H, Ochando J, Harvey RP, Finkel T, Kovacic JC. Santini MP, et al. Cell Rep. 2020 Jan 14;30(2):555-570.e7. doi: 10.1016/j.celrep.2019.12.045. Cell Rep. 2020. PMID: 31940496 Free PMC article. - Diversity of Interstitial Lung Fibroblasts Is Regulated by Platelet-Derived Growth Factor Receptor α Kinase Activity.
Green J, Endale M, Auer H, Perl AK. Green J, et al. Am J Respir Cell Mol Biol. 2016 Apr;54(4):532-45. doi: 10.1165/rcmb.2015-0095OC. Am J Respir Cell Mol Biol. 2016. PMID: 26414960 Free PMC article. - PDGFRα in liver pathophysiology: emerging roles in development, regeneration, fibrosis, and cancer.
Kikuchi A, Monga SP. Kikuchi A, et al. Gene Expr. 2015;16(3):109-27. doi: 10.3727/105221615X14181438356210. Gene Expr. 2015. PMID: 25700367 Free PMC article. Review. - Regulation of PDGF and its receptors in fibrotic diseases.
Bonner JC. Bonner JC. Cytokine Growth Factor Rev. 2004 Aug;15(4):255-73. doi: 10.1016/j.cytogfr.2004.03.006. Cytokine Growth Factor Rev. 2004. PMID: 15207816 Review.
Cited by
- Engineering Stem Cell Fate Controlling Biomaterials to Develop Muscle Connective Tissue Layered Myofibers.
Han S, Lee MC, Rodríguez-delaRosa A, Kim J, Barroso-Zuppa M, Pineda-Rosales M, Kim SS, Hatanaka T, Yazdi IK, Bassous N, Sinha I, Pourquié O, Park S, Shin SR. Han S, et al. Adv Funct Mater. 2024 Jan 15;34(3):2304153. doi: 10.1002/adfm.202304153. Epub 2023 Oct 12. Adv Funct Mater. 2024. PMID: 38707790 - Stiffness-induced cancer-associated fibroblasts are responsible for immunosuppression in a platelet-derived growth factor ligand-dependent manner.
Gamradt P, Thierry K, Masmoudi M, Wu Z, Hernandez-Vargas H, Bachy S, Antonio T, Savas B, Hussain Z, Tomasini R, Milani P, Bertolino P, Hennino A. Gamradt P, et al. PNAS Nexus. 2023 Dec 18;2(12):pgad405. doi: 10.1093/pnasnexus/pgad405. eCollection 2023 Dec. PNAS Nexus. 2023. PMID: 38111825 Free PMC article. - NREP contributes to development of NAFLD by regulating one-carbon metabolism in primary human hepatocytes.
De Jesus DF, Kimura T, Gupta MK, Kulkarni RN. De Jesus DF, et al. Cell Chem Biol. 2023 Sep 21;30(9):1144-1155.e4. doi: 10.1016/j.chembiol.2023.06.001. Epub 2023 Jun 23. Cell Chem Biol. 2023. PMID: 37354909 Free PMC article. - Silencing of UTX Mitigates Aging-Associated Cardiac Fibrosis via Blocking Cardiac Fibroblasts-to-Myofibroblasts Trans-Differentiation.
Li C, Lin T, Li D, Si D, Sun H, Yang S, Zhang Z, Zhang Q, Shi K. Li C, et al. Anatol J Cardiol. 2023 Jul 3;27(7):398-407. doi: 10.14744/AnatolJCardiol.2023.2777. Epub 2023 Jun 7. Anatol J Cardiol. 2023. PMID: 37288854 Free PMC article.
References
- Baroni SS, Santillo M, Bevilacqua F, Luchetti M, Spadoni T, Mancini M, Fraticelli P, Sambo P, Funaro A, Kazlauskas A, et al. Stimulatory autoantibodies to the PDGF receptor in systemic sclerosis. N Engl J Med. 2006;354:2667–2676. - PubMed
Publication types
MeSH terms
Substances
Grants and funding
- R37 HD025326-20/HD/NICHD NIH HHS/United States
- R37 HD025326/HD/NICHD NIH HHS/United States
- R37HD25326/HD/NICHD NIH HHS/United States
- R01 HD024875-21/HD/NICHD NIH HHS/United States
- R01 HD024875/HD/NICHD NIH HHS/United States
- R01HD24875/HD/NICHD NIH HHS/United States
LinkOut - more resources
Full Text Sources
Other Literature Sources
Molecular Biology Databases


