Follicular helper T cells are required for systemic autoimmunity - PubMed (original) (raw)
Follicular helper T cells are required for systemic autoimmunity
Michelle A Linterman et al. J Exp Med. 2009.
Abstract
Production of high-affinity pathogenic autoantibodies appears to be central to the pathogenesis of lupus. Because normal high-affinity antibodies arise from germinal centers (GCs), aberrant selection of GC B cells, caused by either failure of negative selection or enhanced positive selection by follicular helper T (T(FH)) cells, is a plausible explanation for these autoantibodies. Mice homozygous for the san allele of Roquin, which encodes a RING-type ubiquitin ligase, develop GCs in the absence of foreign antigen, excessive T(FH) cell numbers, and features of lupus. We postulated a positive selection defect in GCs to account for autoantibodies. We first demonstrate that autoimmunity in Roquin(san/san) (sanroque) mice is GC dependent: deletion of one allele of Bcl6 specifically reduces the number of GC cells, ameliorating pathology. We show that Roquin(san) acts autonomously to cause accumulation of T(FH) cells. Introduction of a null allele of the signaling lymphocyte activation molecule family adaptor Sap into the sanroque background resulted in a substantial and selective reduction in sanroque T(FH) cells, and abrogated formation of GCs, autoantibody formation, and renal pathology. In contrast, adoptive transfer of sanroque T(FH) cells led to spontaneous GC formation. These findings identify T(FH) dysfunction within GCs and aberrant positive selection as a pathway to systemic autoimmunity.
Figures
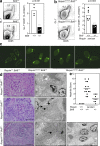
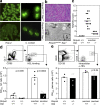
Figure 1.
Heterozygosity for Bcl6 reduces the magnitude of the GC response in Roquin+/+ and Roquinsan/san mice and ameliorates the lupus-like phenotype of Roquinsan/san mice. (a) Flow cytometric contour plots (left) and graphical analysis (right) of B220+GL-7+CD95+ GC B cells in 10-wk-old wild-type (Bcl6+/+) and Bcl6+/− mice 8 d after SRBC immunization (P = 0.0011). Data are representative of four independent experiments (n = 4 per group). (b) Flow cytometric contour plots (left) and dot plots (right) showing B220+GL-7+CD95+ GC B cells from 10-wk-old naive Roquinsan/san Bcl6+/+ and Roquinsan/san Bcl6+/− mice. Data are representative of five independent experiments (n ≥ 4 per group). (c) Representative determination of serum IgG anti-dsDNA from 6-mo-old female Roquin+/+ Bcl6+/+, Roquinsan/san Bcl6+/+, and Roquinsan/san Bcl6+/− mice, determined by immunofluorescence staining of C. luciliae substrate. Data shown reflect the occurrence (n ≥ 6 mice per group); three out of six Roquinsan/san Bcl6+/− mice had low intensity staining (illustrated in the fourth panel from left), and three out of six were negative (illustrated in the third panel from left). (d) Representative images of kidney sections stained with H&E (left) or viewed under an electron microscope (right) from 6-mo-old mice of the indicated genotypes. Roquinsan/san animals show widespread mesangial proliferative lesions with moderate interstitial infiltrate. There are multiple electron-dense deposits (arrows). Histological changes in Roquinsan/san Bcl6+/− mice were mild, with occasional electron-dense deposits visible on electron microscopy in two individuals (far right). Images are representative (n ≥ 4 per group). Bars: (H&E) 100 µm in all panels; (electron microscopy) 5 µm in the Roquin+/+ Bcl6+/+ and Roquinsan/san Bcl6+/+ panels, 2 µm in the left Roquinsan/san Bcl6+/− panels, and 10 µm in the right Roquinsan/san Bcl6+/− panel. (e) Nephritis severity score of 6-mo-old female Roquin+/+, Roquinsan/san, and Roquinsan/san Bcl6+/− mice as determined by histological analysis according to the criteria given in Table S1 (available at
http://www.jem.org/cgi/content/full/jem.20081886/DC1
). Horizontal bars indicate medians. In a, b, and e, each symbol represents one mouse; p-values are indicated on the graphs, and the numbers in the plots represent percentages.
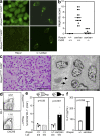
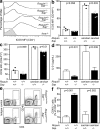
Figure 2.
The autoimmune phenotype of Roquinsan/san mice requires T cell activation through CD28, and TFH cells are expanded cell autonomously. (a, left) Detection of IgG-ANA using Hep-2 slides in sera from 8-wk-old female Roquinsan/san and Roquinsan/san Cd28−/− mice (n = 5 per group). (right) Detection of anti-dsDNA IgG serum antibodies in 6-mo-old female Roquinsan/san and Roquinsan/san Cd28−/− mice determined by staining C. luciliae slides. Data are representative of three independent experiments (n ≥ 5 per group). (b) Score of nephritis severity in 6-mo-old female Roquin+/+ Roquinsan/san and Roquinsan/san Cd28−/− mice as determined by histological analysis defined by the criteria given in Table S1 (available at
http://www.jem.org/cgi/content/full/jem.20081886/DC1
). Each symbol represents one mouse. Horizontal bars indicate medians. (c) Representative images of kidney sections stained with H&E (left) or viewed under an electron microscope (right). Histology from Roquinsan/san Cd28−/− animals was much less severe, with normal H&E appearances and few electron-dense deposits (arrows) in the mesangium. Bars: (left) 100 µm; (right) 10 µm. (d) Representative flow cytometric contour plots of CD4+CXCR5+PD-1high TFH cells in 10-wk-old Roquinsan/san mice and control littermates. Data are representative of five independent experiments (n = 4 per group), and the numbers in the plots represent percentages. (e) Dot plots representing percentages of CD4+CXCR5+PD-1high TFH cells from SRBC-immunized chimeric mice generated by reconstituting sublethally irradiated mice with a 1:1 mix of either Roquin+/+.Ly5a/Roquin+/+.Ly5b (left) or Roquin+/+.Ly5a/ Roquinsan/san.Ly5b (right). Data are representative of three independent experiments (n = 4 per group). Each symbol represents the Ly5a or Ly5b population derived from one mouse. (f) ELISA was used to determine culture supernatant IL-21 levels from 24-h splenocyte cultures from Roquinsan/san mice and littermate controls in the presence of PMA and ionomycin. Error bars indicate means ± SEM. Data are representative of three independent tests where each sample was run in triplicate.
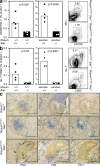
Figure 3.
Spontaneous GC and TFH formation are corrected by loss of SAP in Roquinsan/san mice. (a) CD4+CXCR5+PD-1high TFH cells in unimmunized 10-wk-old Roquinsan/san and Roquinsan/san Sap−/− mice (P = 0.0056). Representative flow cytometric contour plots are shown (right). Data are representative of four independent experiments (n = 4 per group). (b) B220+GL-7+CD95+ GC B cells in unimmunized 10-wk-old Roquinsan/san Sap+/+ and Roquinsan/san Sap−/− mice (P = 0.0007). Representative flow cytometric contour plots are shown (right). Data are representative of four independent experiments (n = 4 per group). (c) Photomicrographs of frozen spleen sections from unimmunized 6-mo-old mice of the indicated genotypes stained with IgD (brown; all panels), PNA (blue; left), TCRβ (blue; middle), and PD-1 (blue; right). Bars, 200 µm.
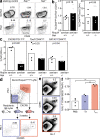
Figure 4.
Th1 and Th2 cells are present in Roquinsan/san mice in the absence of SAP and TFH cells, but not non-TFH effector cells, induce a GC response in wild-type mice. (a) Representative flow cytometric contour plots and (b) graphical analysis of GATA3+CD44highCD4+ and Tbet+CD44highCD4+ cells in mice of the indicated genotypes. Data are representative of two independent experiments (n ≥ 4 per group). (c) Representative dot plots of lymph node CD4+PD-1highCXCR5+ (left), Tbet+CD44 highCD4+ (middle), and GATA3+CD44highCD4+ (right) cells. (d) Experimental outline for adoptive transfer of Roquinsan/san CD4+ CD45.2 CD44high PD-1high CXCR5+ or CD4+ CD45.2 CD44high PD-1− CXCR5− T cells into CD45.1 C57BL/6 mice. (e) Flow cytometric contour plots and (f) dot plots of B220+ GL-7+ CD95+ GC B cells from CD45.1 C57BL/6 recipients 3 wk after adoptive transfer of the indicated cell type. Data were generated from three mice per group (**, P > 0.001). In a, d, and e, the numbers in the plots represent percentages.
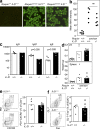
Figure 5.
Serum autoantibodies and renal pathology in Roquinsan/san Sap−/− mice and reduction of the GC response in SAP-deficient Roquinsan/san mice is caused by B cell–extrinsic factors. (a, left) Representative staining of Hep-2 slides for detection of IgG ANA in the serum of 8-wk-old female Roquinsan/san and Roquinsan/san Sap−/− mice (n = 5 per group). (right) Detection of IgG anti-dsDNA serum antibodies in 6-mo-old female Roquinsan/san and Roquinsan/san Sap−/− mice determined by immunofluorescence staining using C. luciliae substrate. Data are representative of three independent experiments (n ≥ 5 per group). (b) Representative images of kidney sections stained with H&E (top) or viewed under an electron microscope (bottom) from 6-mo-old female Roquinsan/san Sap−/− mice. Roquinsan/san Sap−/− mice show slight mesangial expansion on H&E staining but no electron-dense deposits. Bars: (top) 100 µm; (bottom) 5 µm. (c) Score of nephritis severity in 6-mo-old female Roquin+/+, Roquinsan/san, and Roquinsan/san Sap−/− mice as determined by histological analysis according to the criteria given in Table S1 (available at
http://www.jem.org/cgi/content/full/jem.20081886/DC1
). Each symbol represents one mouse. Horizontal bars indicate medians. (d) Gating strategy for assessing the HEL-specific GC response (top) and graphic representation (bottom) of the total number of HEL-specific GC cells per spleen in mice with the indicated genotypes 7 d after cotransfer of SWHEL B cells and HEL2x-conjugated SRBCs. Data are representative of three independent experiments (n ≥ 4). Each symbol represents one mouse. (e) Gating strategy for determining HEL-specific extrafollicular plasma cells (top) and graphical representation (bottom) of the number of HEL-specific plasma cells 5 d after cotransfer into mice with the indicated genotypes. Data are representative of two independent experiments (n ≥ 3 per group). p-values are indicated on graphs.
Figure 6.
TFH cell–associated molecules are decreased in Roquinsan/san Sap−/− mice. (a) Representative flow cytometric histograms and (b and c) graphical analysis showing ICOS mean fluorescence intensity (MFI) of splenic naive CD44low (b) and activated/memory CD44high (c) CD4+ T cells from 10-wk-old unimmunized mice of the indicated genotypes. Data are representative of three independent experiments. Each symbol represents one mouse. (d) ELISA quantification of IL-21 in supernatant from an overnight culture of splenocytes in the presence of PMA and ionomycin from mice of the indicated genotypes. Data are representative of three experiments. (e) Flow cytometric contour plots of CD40L expression on splenocytes, 5 h after stimulation with anti-CD3 and anti-CD28, derived from mice of the indicated genotypes. (left) Staining with an isotype control; (right) CD40L staining. (f) Histograms of the percentage of CD4+ cells that express CD40L (gated as shown in e) 5 h after CD3 and CD28 stimulation on splenocytes from mice with the indicated genotypes. In d and f, error bars indicate means ± SEM.
Figure 7.
Lack of IL-21 does not affect the phenotype, TFH cell accumulation, or GC formation of Roquinsan/san mice. (a) IgG ANAs in the serum of mice of the genotypes indicated, detected by immunofluorescence using Hep-2 substrate. Data are representative of three independent experiments (n ≥ 5 mice per group). (b) Score of ANA staining intensity by confocal microscopy from sera taken from mice of the indicated genotypes. Data are representative of three independent experiments (n ≥ 5 mice per group). (c) Basal serum total IgG, IgG1, and IgE measured by ELISA. Data are representative of two independent experiments (n = 5 mice per group). (d) Lymph node and spleen weight in grams for mice of the indicated genotypes. Data are representative of two independent experiments (n ≥ 5 per group). (e) Flow cytometric contour plots and dot plots of PD-1highCXCR5+CD4+ TFH cells and (f) GL-7+CD95+B220+ GC cells from mice of the indicated genotypes. Data are representative of two independent experiments (n ≥ 5 mice per group). In e and f, the numbers in the plots represent percentages.
Similar articles
- Expansion of circulating T cells resembling follicular helper T cells is a fixed phenotype that identifies a subset of severe systemic lupus erythematosus.
Simpson N, Gatenby PA, Wilson A, Malik S, Fulcher DA, Tangye SG, Manku H, Vyse TJ, Roncador G, Huttley GA, Goodnow CC, Vinuesa CG, Cook MC. Simpson N, et al. Arthritis Rheum. 2010 Jan;62(1):234-44. doi: 10.1002/art.25032. Arthritis Rheum. 2010. PMID: 20039395 - Myeloid-Derived Suppressor Cells Induce the Expansion of Regulatory B Cells and Ameliorate Autoimmunity in the Sanroque Mouse Model of Systemic Lupus Erythematosus.
Park MJ, Lee SH, Kim EK, Lee EJ, Park SH, Kwok SK, Cho ML. Park MJ, et al. Arthritis Rheumatol. 2016 Nov;68(11):2717-2727. doi: 10.1002/art.39767. Arthritis Rheumatol. 2016. PMID: 27214349 - B7RP-1 blockade ameliorates autoimmunity through regulation of follicular helper T cells.
Hu YL, Metz DP, Chung J, Siu G, Zhang M. Hu YL, et al. J Immunol. 2009 Feb 1;182(3):1421-8. doi: 10.4049/jimmunol.182.3.1421. J Immunol. 2009. PMID: 19155489 - Roquin--a multifunctional regulator of immune homeostasis.
Schaefer JS, Klein JR. Schaefer JS, et al. Genes Immun. 2016 Mar;17(2):79-84. doi: 10.1038/gene.2015.58. Epub 2015 Dec 17. Genes Immun. 2016. PMID: 26673963 Free PMC article. Review. - IL-21 and T follicular helper cells.
Spolski R, Leonard WJ. Spolski R, et al. Int Immunol. 2010 Jan;22(1):7-12. doi: 10.1093/intimm/dxp112. Epub 2009 Nov 23. Int Immunol. 2010. PMID: 19933709 Free PMC article. Review.
Cited by
- SLAM Associated Protein Signaling in T Cells: Tilting the Balance Toward Autoimmunity.
Gartshteyn Y, Askanase AD, Mor A. Gartshteyn Y, et al. Front Immunol. 2021 Apr 16;12:654839. doi: 10.3389/fimmu.2021.654839. eCollection 2021. Front Immunol. 2021. PMID: 33936082 Free PMC article. Review. - B cell-intrinsic CD84 and Ly108 maintain germinal center B cell tolerance.
Wong EB, Soni C, Chan AY, Domeier PP, Shwetank, Abraham T, Limaye N, Khan TN, Elias MJ, Chodisetti SB, Wakeland EK, Rahman ZS. Wong EB, et al. J Immunol. 2015 May 1;194(9):4130-43. doi: 10.4049/jimmunol.1403023. Epub 2015 Mar 23. J Immunol. 2015. PMID: 25801429 Free PMC article. - Resolve, revise, and relax: the 3 Rs of B cell repertoire adjustment.
Scholz JL, Cancro MP. Scholz JL, et al. Immunol Lett. 2012 Mar 30;143(1):2-8. doi: 10.1016/j.imlet.2012.01.014. Epub 2012 Feb 6. Immunol Lett. 2012. PMID: 22330846 Free PMC article. Review. - T-Follicular Regulatory Cells: Potential Therapeutic Targets in Rheumatoid Arthritis.
Ding T, Niu H, Zhao X, Gao C, Li X, Wang C. Ding T, et al. Front Immunol. 2019 Nov 26;10:2709. doi: 10.3389/fimmu.2019.02709. eCollection 2019. Front Immunol. 2019. PMID: 31849938 Free PMC article. Review. - Impact of Corticosteroids on the Proportions of Circulating Tfh Cell Subsets in Patients With Systemic Lupus Erythematous.
Mao M, Xu S, Lin L, Dong D, Xue M, He S, Cai G. Mao M, et al. Front Med (Lausanne). 2022 Jul 5;9:949334. doi: 10.3389/fmed.2022.949334. eCollection 2022. Front Med (Lausanne). 2022. PMID: 35865165 Free PMC article.
References
- Hochberg M.C. 1997. Updating the American College of Rheumatology revised criteria for the classification of systemic lupus erythematosus.Arthritis Rheum. 40:1725. - PubMed
- Arbuckle M.R., McClain M.T., Rubertone M.V., Scofield R.H., Dennis G.J., James J.A., Harley J.B. 2003. Development of autoantibodies before the clinical onset of systemic lupus erythematosus.N. Engl. J. Med. 349:1526–1533 - PubMed
- Rahman A., Isenberg D.A. 2008. Systemic lupus erythematosus.N. Engl. J. Med. 358:929–939 - PubMed
- MacLennan I.C., Toellner K.M., Cunningham A.F., Serre K., Sze D.M., Zuniga E., Cook M.C., Vinuesa C.G. 2003. Extrafollicular antibody responses.Immunol. Rev. 194:8–18 - PubMed
- Jacob J., Kelsoe G., Rajewsky K., Weiss U. 1991. Intraclonal generation of antibody mutants in germinal centers.Nature. 354:389–392 - PubMed
Publication types
MeSH terms
Substances
LinkOut - more resources
Full Text Sources
Other Literature Sources
Molecular Biology Databases
Miscellaneous
