The involvement of hypothalamic sleep pathways in general anesthesia: testing the hypothesis using the GABAA receptor beta3N265M knock-in mouse - PubMed (original) (raw)
The involvement of hypothalamic sleep pathways in general anesthesia: testing the hypothesis using the GABAA receptor beta3N265M knock-in mouse
Anna Y Zecharia et al. J Neurosci. 2009.
Abstract
The GABA(A) receptor has been identified as the single most important target for the intravenous anesthetic propofol. How effects at this receptor are then translated into a loss of consciousness, however, remains a mystery. One possibility is that anesthetics act on natural sleep pathways. Here, we test this hypothesis by exploring the anesthetic sensitivities of GABAergic synaptic currents in three specific brain nuclei that are known to be involved in sleep. Using whole-cell electrophysiology, we have recorded GABAergic IPSCs from the tuberomammillary nucleus (TMN), the perifornical area (Pef), and the locus ceruleus (LC) in brain slices from both wild-type mice and mice that carry a specific mutation in the GABA(A) receptor beta(3) subunit (N265M), which greatly reduces their sensitivity to propofol, but not to the neurosteroid alphaxalone. We find that this in vivo pattern of anesthetic sensitivity is mirrored in the hypothalamic TMN and Pef nuclei, consistent with their role as direct anesthetic targets. In contrast, anesthetic sensitivity in the LC was unaffected by the beta(3)N265M mutation, ruling out this nucleus as a major target for propofol. In support of the hypothesis that orexinergic neurons in the Pef are involved in propofol anesthesia, we further show that these neurons are selectively inhibited by GABAergic drugs in vivo during anesthesia, and that a modulation in the activity of Pef neurons alone can affect loss of righting reflex. Overall, our results support the idea that GABAergic anesthetics such as propofol exert their effects, at least in part, by modulating hypothalamic sleep pathways.
Figures
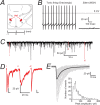
Figure 1.
Characterization of GABAergic IPSCs in identified orexinergic Pef neurons. A, The coronal slice shows the location of the perifornical region (highlighted in red) with respect to the fornix (fx). We used slices corresponding to ∼−1.7 mm from the Bregma. B, The left panel shows an example of a tonically firing (∼11 Hz) orexinergic neuron with a depolarized membrane potential (approximately −46 mV) compared with a relatively hyperpolarized (resting at approximately −60 mV), silent MCH-containing neuron shown on the right. C, Continuous current trace recorded from a WT orexinergic Pef neuron under voltage clamp (−60 mV). In this example, IPSCs occurred at an average frequency of 1.6 Hz and were confirmed as GABAergic due to their bicuculline sensitivity (data not shown; n = 10). Individual events (i–iii) highlighted in red were representative of three IPSC groups. D, Expanded trace for each example highlighted in C. The first trace (i) shows superimposition of IPSCs interrupting the decay phase. The second trace (ii) shows superimposition of IPSCs interrupting the rising phase. Finally, the third trace (iii) shows a single, isolated IPSC. To get an accurate representation of the IPSC parameters, only events falling into category (iii) were included in the analysis. E, Isolated IPSCs from a typical orexinergic neuron. The isolated events (77 events, shown in gray) were used to construct the average IPSC trace (shown in black) of the neuron. This example average IPSC trace had a 10–90% rise time of 1.3 ms, a peak amplitude of −69.2 pA and a decay time of 15.9 ms. The histogram shows the distribution of peak amplitudes recorded from all wild-type orexinergic neurons. The coefficient of variation was 59.4 ± 7.0% (n = 9).
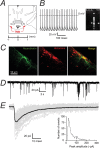
Figure 2.
Characterization of GABAergic IPSCs in identified histaminergic neurons in the TMN. A, The coronal slice shows the location of the TMN (highlighted in red) as ventrolateral to the fornix (fx) at the level of the mammillary recess. We used slices corresponding to ∼−2.1 mm from the Bregma. B, A tonically firing (4.4 Hz) TMN neuron is shown on the left. On the right is an example of mRNA expression for the histaminergic neuronal marker ADA and β1–3 subunit of the GABAA receptor in a single neuron using single cell RT-PCR. Tonic firing and expression of ADA was typical of large cells in this region. C, A typical histaminergic TMN neuron. The left panel shows a neurobiotin-filled neuron following whole-cell recording, the center panel shows the staining pattern for histamine and the right panel is the merged image. D, GABAergic IPSCs recorded in the whole-cell configuration from a typical histaminergic TMN neuron. IPSCs occurred at a frequency of ∼1.5 Hz. E, A representative average trace (shown in black) was constructed from monotonic IPSCs (49 events, shown in gray). This example average IPSC had a 10–90% rise time of 1.8 ms, a peak amplitude of −56.0 pA and a decay time of 23.3 ms. The histogram shows the distribution of peak amplitudes recorded from all wild-type histaminergic neurons. The coefficient of variation was 60.0 ± 7.8% (n = 12).
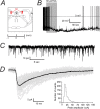
Figure 3.
Characterization of GABAergic IPSCs in identified noradrenergic neurons in the LC. A, A coronal slice shows the LC (highlighted in red) as being at the floor of the fourth ventricle (4 V) and ventral to the cerebellum. We used slices corresponding to ∼−5.9 mm from the Bregma. B, Tonic firing (∼1.8 Hz) of an LC neuron recorded in current clamp, which hyperpolarized (from approximately −55 mV to −75 mV) and ceased firing after exposure to 30 μ
m
noradrenaline (NA). This reversible autoreceptor response is characteristic of noradrenergic neurons and was seen in all recorded cells. C, A continuous trace showing GABAergic IPSCs recorded in voltage clamp from a typical LC neuron. D, Isolated IPSCs (37 events, shown in gray) were selected to construct a representative trace (shown in black) of individual IPSC properties. This example average IPSC had a 10–90% rise time of 3.5 ms, a peak amplitude of −28.2 pA and a decay time of 28.5 ms. The histogram shows the distribution of peak amplitudes recorded from all wild-type noradrenergic neurons. The coefficient of variation was 50.2 ± 4.3% (n = 12).
Figure 4.
The β3N265M mutation does not affect control IPSC properties in Pef, TMN and LC neurons. A–C, The average IPSCs constructed from each recorded WT neuron (black traces) are shown together with the average β3N265M IPSCs (shown in red), the Pef (A; WT n = 9, β3N265M n = 8), the TMN (B; WT n = 12, β3N265M n = 12), and the LC (C; WT n = 12, β3N265M n = 10). D, Average 10–90% rise times for WT and knock-in Pef neurons (1.2 ± 0.1 ms; 1.3 ± 0.1 ms; means ± SEMs), TMN neurons (1.9 ± 0.2 ms; 2.1 ± 0.2 ms) and LC neurons (3.7 ± 0.4 ms; 3.3 ± 0.4 ms) respectively are shown in the top panel. E, Decay times for WT and β3N265M Pef neurons (21.3 ± 1.5 ms; 24.6 ± 2.3 ms), TMN neurons (30.3 ± 2.8 ms; 31.0 ± 2.1 ms) and LC neurons (37.1 ± 2.5 ms; 32.6 ± 2.2 ms). F, Average peak amplitudes for WT and β3N265M Pef neurons (−50.2 ± 6.6 pA; 35.3 ± 4.5 pA), TMN neurons (−37.4 ± 5.2 pA; 51.4 ± 9.2 pA), LC neurons (−19.0 ± 1.6 pA; −19.6 ± 1.5 pA). There were no differences in IPSC parameters between WT and β3N265M knock-in animals in any of the brain regions studied.
Figure 5.
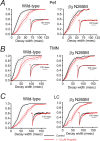
The neurosteroid alphaxalone markedly increases GABAergic IPSC decay times in both WT and β3N265M knock-in Pef, TMN, and LC neurons. The main traces in each panel shows the effects of alphaxalone on the cumulative probability distributions of IPSC decay times averaged across all recorded neurons under control conditions (black curve) and during exposure to 2 μ
m
alphaxalone (red curve). The lighter lines show the SEMs. The insets show representative average IPSCs (normalized to peak amplitude) from individual neurons. A, The cumulative decay time distributions for Pef neurons from both WT and β3N265M knock-in mice show clear, and comparable, rightward shifts in the presence of alphaxalone (for WT neurons, τ increased by 175 ± 30%, n = 5, and for β3N265M neurons, τ increased by 159 ± 30%, n = 4). Data from a typical WT Pef neuron (left inset), shows a large increase in the average IPSC decay time from 17 ms (n = 51) for control, to 53 ms (n = 81) in the presence of alphaxalone. Data from a typical β3N265M Pef neuron (right inset) shows a similar increase from 16 ms (n = 51) to 40 ms (n = 105). B, The cumulative decay time distributions for TMN neurons from both WT and β3N265M knock-in mice show clear, and comparable, rightward shifts (for WT neurons, τ increased by 188 ± 30%, n = 5, and for β3N265M neurons, τ increased by 178 ± 41%, n = 4). Data from a typical WT TMN neuron (left inset), shows a large increase in the average IPSC decay time from 24 ms (n = 63) for control to 71 ms (n = 49) in the presence of alphaxalone. Data from a typical β3N265M TMN neuron (right inset) shows a similar increase from 21 ms (n = 50) to 82 ms (n = 48). C, The cumulative decay time distributions for LC neurons from both WT and β3N265M knock-in mice show clear, and comparable, rightward shifts (for WT neurons, τ increased by 149 ± 15%, n = 8, and for β3N265M neurons, τ increased by 154 ± 26%, n = 6). Data from a typical WT LC neuron (left inset), shows a large increase in the average IPSC decay time from 27 ms (n = 127) for control to 52 ms (n = 71) in the presence of alphaxalone. Data from a typical β3N265M LC neuron (right inset) shows a similar increase from 29 ms (n = 59) to 78 ms (n = 47).
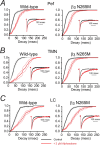
Figure 6.
The contrasting effects of propofol on IPSC decay times in WT and β3N265M knock-in Pef, TMN and LC. Each panel shows the effect of propofol on the cumulative frequency distribution of IPSC decay times averaged across all recorded neurons before (black curve) and during exposure to 1.5 μ
m
propofol (red curve). The lighter lines show the SEMs. The insets show the average IPSC decay phase from a representative neuron. A, For WT Pef neurons the cumulative frequency distributions show that, on average, propofol causes a 100 ± 14% (n = 5) increase in median decay time. The left inset shows data from a typical WT Pef neuron. The average IPSC decay time under control conditions was 21 ms (n = 51), which increased to 50 ms (n = 81) in the presence of propofol. In contrast, propofol caused an increase of only 16 ± 4% (n = 4) in β3N265M knock-in neurons. The right inset shows data from a typical β3N265M Pef neuron. The average IPSC decay time was 19 ms (n = 51) under control conditions and did not change significantly in the presence of propofol (20 ms; n = 105). B, For WT TMN neurons the cumulative frequency distributions show that, on average, propofol causes an 124 ± 18% (n = 7) increase in median decay time. The left inset shows data from a typical WT TMN neuron. The average decay time was 19 ms (n = 63), which increased to 48 ms (n = 49) in the presence of propofol. However, propofol caused an increase of only 23 ± 11% (n = 8) in β3N265M knock-in neurons. The right inset shows data for a typical β3N265M TMN neuron. Propofol minimally affected the IPSC decay time, changing it from 20 ms (n = 50) to 21 ms (n = 48). C, In the LC, cumulative frequency distributions show that, on average, propofol causes a similar increase in decay times for WT and β3N265M knock-in neurons (79 ± 29%, n = 4, increase in median decay time in WT LC neurons and 89 ± 23%, n = 4, in β3N265M knock-in neurons). The left inset shows data from a typical WT LC neuron. Propofol caused an increase in IPSC decay time from 27 ms (n = 127) to 57 ms (n = 71). The right inset shows data from a typical LC neuron from the β3N265M knock-in. Propofol caused an increase in IPSC decay time from 35 ms (n = 59) to 51 ms (n = 47).
Figure 7.
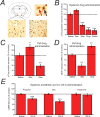
Evidence for the involvement of orexinergic neurons in anesthetic-induced LORR. A, The schematic coronal slice (top left) shows the location of Pef orexinergic neurons (red) close to the fornix. The image top right shows 3,3-diaminobenzidine tetrahydrochloride-visualized neurons, double-stained for cytosolic orexin-A (brown) and nuclear c-Fos (black). The red arrow points to a single-labeled orexinergic-positive, but c-Fos-negative neuron and the black arrow indicates a double-labeled c-Fos-positive orexinergic neuron. The lower images show (left) a level of c-Fos expression in orexinergic neurons following systemic dexmedetomidine (Dex; 150 μg/kg) that is similar to control levels, in contrast to the marked depression of c-Fos expression observed (right) following pentobarbital administration (Pento; 50 mg/kg). B, C-Fos-positive neurons following systemic administration of dexmedetomidine (Dex; 150 μg/kg, i.p.), muscimol (Mus; 5 mg/kg, i.p.), propofol (Prop; 100 mg/kg, i.p.) and pentobarbital (Pento; 50 mg/kg, i.p.) expressed as a percentage of those observed following saline administration. Following saline injection, 47.8 ± 2.9% of orexinergic neurons were c-Fos positive. C, When administered directly into the Pef (bilateral injections, 0.2 μg/0.2 μl/side), the GABAA receptor antagonist gabazine increases c-Fos expression in orexinergic neurons, whereas the GABAA receptor agonist muscimol decreases expression compared with the injection of control saline (normalized to 100%; 45.5 ± 4.4% of neurons were c-Fos positive), showing that the activity of Pef neurons can be modulated by GABAergic agents. D, When administered directly into the Pef (bilateral injections, 0.2 μg/0.2 μl/side), gabazine antagonizes Dex-induced LORR (150 μg/kg, s.c.), whereas muscimol significantly increases Dex-induced LORR compared with the injection of control saline (normalized to 100%; control sleep time was 286 min), showing that the modulation of Pef neurons can directly influence LORR. Significance was tested using an unpaired Student's t test. E, The intracerebroventricular administration of orexin-A significantly antagonizes propofol and dexmedetomidine anesthesia, but has no effect on ketamine anesthesia compared with the intracerebroventricular injection of saline. In each case the mean control sleep times have been normalized to 100% (control sleep times were 8.2 min for Prop, 26.2 min for Dex and 3.6 min for ketamine). Significance was tested using a paired Student's t test with respect to control saline injections on the same animal. The data are means ± SEMs, and the asterisks denote the level of significance (*p < 0.05, **p < 0.01, ***p < 0.001).
Similar articles
- GABAA receptors involved in sleep and anaesthesia: β1- versus β3-containing assemblies.
Yanovsky Y, Schubring S, Fleischer W, Gisselmann G, Zhu XR, Lübbert H, Hatt H, Rudolph U, Haas HL, Sergeeva OA. Yanovsky Y, et al. Pflugers Arch. 2012 Jan;463(1):187-99. doi: 10.1007/s00424-011-0988-4. Epub 2011 Jul 7. Pflugers Arch. 2012. PMID: 21735059 - Pharmacological properties of GABAA receptors in rat hypothalamic neurons expressing the epsilon-subunit.
Sergeeva OA, Andreeva N, Garret M, Scherer A, Haas HL. Sergeeva OA, et al. J Neurosci. 2005 Jan 5;25(1):88-95. doi: 10.1523/JNEUROSCI.3209-04.2005. J Neurosci. 2005. PMID: 15634770 Free PMC article. - The sedative component of anesthesia is mediated by GABA(A) receptors in an endogenous sleep pathway.
Nelson LE, Guo TZ, Lu J, Saper CB, Franks NP, Maze M. Nelson LE, et al. Nat Neurosci. 2002 Oct;5(10):979-84. doi: 10.1038/nn913. Nat Neurosci. 2002. PMID: 12195434 - GABAergic inhibition of histaminergic neurons regulates active waking but not the sleep-wake switch or propofol-induced loss of consciousness.
Zecharia AY, Yu X, Götz T, Ye Z, Carr DR, Wulff P, Bettler B, Vyssotski AL, Brickley SG, Franks NP, Wisden W. Zecharia AY, et al. J Neurosci. 2012 Sep 19;32(38):13062-75. doi: 10.1523/JNEUROSCI.2931-12.2012. J Neurosci. 2012. PMID: 22993424 Free PMC article. - The ventrolateral preoptic nucleus is required for propofol-induced inhibition of locus coeruleus neuronal activity.
Zhang Y, Yu T, Yuan J, Yu BW. Zhang Y, et al. Neurol Sci. 2015 Dec;36(12):2177-84. doi: 10.1007/s10072-015-2292-0. Epub 2015 Aug 26. Neurol Sci. 2015. PMID: 26306695
Cited by
- Human ARHGEF9 intellectual disability syndrome is phenocopied by a mutation that disrupts collybistin binding to the GABAA receptor α2 subunit.
Hines DJ, Contreras A, Garcia B, Barker JS, Boren AJ, Moufawad El Achkar C, Moss SJ, Hines RM. Hines DJ, et al. Mol Psychiatry. 2022 Mar;27(3):1729-1741. doi: 10.1038/s41380-022-01468-z. Epub 2022 Feb 15. Mol Psychiatry. 2022. PMID: 35169261 Free PMC article. - Central chemoreception in wakefulness and sleep: evidence for a distributed network and a role for orexin.
Nattie E, Li A. Nattie E, et al. J Appl Physiol (1985). 2010 May;108(5):1417-24. doi: 10.1152/japplphysiol.01261.2009. Epub 2010 Feb 4. J Appl Physiol (1985). 2010. PMID: 20133433 Free PMC article. Review. - Excitatory Pathways from the Lateral Habenula Enable Propofol-Induced Sedation.
Gelegen C, Miracca G, Ran MZ, Harding EC, Ye Z, Yu X, Tossell K, Houston CM, Yustos R, Hawkins ED, Vyssotski AL, Dong HL, Wisden W, Franks NP. Gelegen C, et al. Curr Biol. 2018 Feb 19;28(4):580-587.e5. doi: 10.1016/j.cub.2017.12.050. Epub 2018 Feb 1. Curr Biol. 2018. PMID: 29398217 Free PMC article. - Effects of orexin-A on propofol anesthesia in rats.
Shirasaka T, Yonaha T, Onizuka S, Tsuneyoshi I. Shirasaka T, et al. J Anesth. 2011 Feb;25(1):65-71. doi: 10.1007/s00540-010-1071-6. Epub 2010 Dec 10. J Anesth. 2011. PMID: 21153424 - GABAA receptors involved in sleep and anaesthesia: β1- versus β3-containing assemblies.
Yanovsky Y, Schubring S, Fleischer W, Gisselmann G, Zhu XR, Lübbert H, Hatt H, Rudolph U, Haas HL, Sergeeva OA. Yanovsky Y, et al. Pflugers Arch. 2012 Jan;463(1):187-99. doi: 10.1007/s00424-011-0988-4. Epub 2011 Jul 7. Pflugers Arch. 2012. PMID: 21735059
References
- Abrahamson EE, Moore RY. The posterior hypothalamic area: chemoarchitecture and afferent connections. Brain Res. 2001;889:1–22. - PubMed
- Bai D, Zhu G, Pennefather P, Jackson MF, MacDonald JF, Orser BA. Distinct functional and pharmacological properties of tonic and quantal inhibitory postsynaptic currents mediated by gamma-aminobutyric acid(A) receptors in hippocampal neurons. Mol Pharmacol. 2001;59:814–824. - PubMed
- Bayer L, Eggermann E, Serafin M, Grivel J, Machard D, Muhlethaler M, Jones BE. Opposite effects of noradrenaline and acetylcholine upon hypocretin/orexin versus melanin concentrating hormone neurons in rat hypothalamic slices. Neuroscience. 2005;130:807–811. - PubMed
Publication types
MeSH terms
Substances
LinkOut - more resources
Full Text Sources
Other Literature Sources
Molecular Biology Databases
