Statistical inferences for isoform expression in RNA-Seq - PubMed (original) (raw)
Statistical inferences for isoform expression in RNA-Seq
Hui Jiang et al. Bioinformatics. 2009.
Abstract
The development of RNA sequencing (RNA-Seq) makes it possible for us to measure transcription at an unprecedented precision and throughput. However, challenges remain in understanding the source and distribution of the reads, modeling the transcript abundance and developing efficient computational methods. In this article, we develop a method to deal with the isoform expression estimation problem. The count of reads falling into a locus on the genome annotated with multiple isoforms is modeled as a Poisson variable. The expression of each individual isoform is estimated by solving a convex optimization problem and statistical inferences about the parameters are obtained from the posterior distribution by importance sampling. Our results show that isoform expression inference in RNA-Seq is possible by employing appropriate statistical methods.
Figures
Fig. 1.
Histogram of gene expressions in liver samples in the unit of RPKM. Genes are grouped into eight log-scaled bins according to their expressions. Genes are considered to be lowly (or highly) expressed if their RPKMs are below 1 (or above 100). Genes that have RPKMs between 1 and 100 are considered to be moderately expressed.
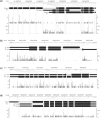
Fig. 2.
(a) Visualization of RNA-Seq reads falling into mouse gene Pdlim5 in CisGenome Browser (Ji et al., 2008). The four horizontal tracks in the picture are (from top to bottom): genomic coordinates, gene structure where exons are magnified for better visualization, the reads falling into each genomic coordinate in brain and muscle samples, where the red or blue bar represents the number of reads on the forward or reverse strand that starts at that position. Visualization of mouse genes Dbi (b), Clk1 (c) and Fetub (d) in brain tissue.
Fig. 3.
Statistical inference using importance sampling for mouse gene Fetub in brain tissue (Fig. 2d). Histograms of marginal posterior distribution of θ1, θ2 and θ3 are given in (a), (b) and (c), respectively. The gene expression is shown in (d) as a reference. The two red dotted vertical lines in each pictures are the boundaries for the 95% probability intervals. (e), (f) and (g) are the heatmaps showing marginal posterior distributions of all two-parameter combinations. We can see from the heatmaps that θ1 is almost uncorrelated with the other two parameters, while θ2 and θ3 are negatively correlated.
Similar articles
- Using non-uniform read distribution models to improve isoform expression inference in RNA-Seq.
Wu Z, Wang X, Zhang X. Wu Z, et al. Bioinformatics. 2011 Feb 15;27(4):502-8. doi: 10.1093/bioinformatics/btq696. Epub 2010 Dec 17. Bioinformatics. 2011. PMID: 21169371 - TIGAR2: sensitive and accurate estimation of transcript isoform expression with longer RNA-Seq reads.
Nariai N, Kojima K, Mimori T, Sato Y, Kawai Y, Yamaguchi-Kabata Y, Nagasaki M. Nariai N, et al. BMC Genomics. 2014;15 Suppl 10(Suppl 10):S5. doi: 10.1186/1471-2164-15-S10-S5. Epub 2014 Dec 12. BMC Genomics. 2014. PMID: 25560536 Free PMC article. - Isoform abundance inference provides a more accurate estimation of gene expression levels in RNA-seq.
Wang X, Wu Z, Zhang X. Wang X, et al. J Bioinform Comput Biol. 2010 Dec;8 Suppl 1:177-92. doi: 10.1142/s0219720010005178. J Bioinform Comput Biol. 2010. PMID: 21155027 - Differential Expression Analysis of RNA-seq Reads: Overview, Taxonomy, and Tools.
Chowdhury HA, Bhattacharyya DK, Kalita JK. Chowdhury HA, et al. IEEE/ACM Trans Comput Biol Bioinform. 2020 Mar-Apr;17(2):566-586. doi: 10.1109/TCBB.2018.2873010. Epub 2018 Oct 1. IEEE/ACM Trans Comput Biol Bioinform. 2020. PMID: 30281477 Review. - Characterizing and annotating the genome using RNA-seq data.
Chen G, Shi T, Shi L. Chen G, et al. Sci China Life Sci. 2017 Feb;60(2):116-125. doi: 10.1007/s11427-015-0349-4. Epub 2016 Jun 13. Sci China Life Sci. 2017. PMID: 27294835 Review.
Cited by
- Oases: robust de novo RNA-seq assembly across the dynamic range of expression levels.
Schulz MH, Zerbino DR, Vingron M, Birney E. Schulz MH, et al. Bioinformatics. 2012 Apr 15;28(8):1086-92. doi: 10.1093/bioinformatics/bts094. Epub 2012 Feb 24. Bioinformatics. 2012. PMID: 22368243 Free PMC article. - Differential analysis of gene regulation at transcript resolution with RNA-seq.
Trapnell C, Hendrickson DG, Sauvageau M, Goff L, Rinn JL, Pachter L. Trapnell C, et al. Nat Biotechnol. 2013 Jan;31(1):46-53. doi: 10.1038/nbt.2450. Epub 2012 Dec 9. Nat Biotechnol. 2013. PMID: 23222703 Free PMC article. - Exploring the feasibility of next-generation sequencing and microarray data meta-analysis.
Wu PY, Phan JH, Wang MD. Wu PY, et al. Annu Int Conf IEEE Eng Med Biol Soc. 2011;2011:7618-21. doi: 10.1109/IEMBS.2011.6091877. Annu Int Conf IEEE Eng Med Biol Soc. 2011. PMID: 22256102 Free PMC article. - IDBA-tran: a more robust de novo de Bruijn graph assembler for transcriptomes with uneven expression levels.
Peng Y, Leung HC, Yiu SM, Lv MJ, Zhu XG, Chin FY. Peng Y, et al. Bioinformatics. 2013 Jul 1;29(13):i326-34. doi: 10.1093/bioinformatics/btt219. Bioinformatics. 2013. PMID: 23813001 Free PMC article. - DICER- and AGO3-dependent generation of retinoic acid-induced DR2 Alu RNAs regulates human stem cell proliferation.
Hu Q, Tanasa B, Trabucchi M, Li W, Zhang J, Ohgi KA, Rose DW, Glass CK, Rosenfeld MG. Hu Q, et al. Nat Struct Mol Biol. 2012 Nov;19(11):1168-75. doi: 10.1038/nsmb.2400. Epub 2012 Oct 14. Nat Struct Mol Biol. 2012. PMID: 23064648 Free PMC article.
References
- Cloonan N, et al. Stem cell transcriptome profiling via massive-scale mRNA sequencing. Nat. Methods. 2008;5:613–619. - PubMed
Publication types
MeSH terms
Substances
Grants and funding
- R01 HG003903/HG/NHGRI NIH HHS/United States
- R01 HG004634/HG/NHGRI NIH HHS/United States
- U54 GM062119/GM/NIGMS NIH HHS/United States
- U54 GM62119/GM/NIGMS NIH HHS/United States
LinkOut - more resources
Full Text Sources
Other Literature Sources


