Global diversity in the human salivary microbiome - PubMed (original) (raw)
Global diversity in the human salivary microbiome
Ivan Nasidze et al. Genome Res. 2009 Apr.
Abstract
The human salivary microbiome may play a role in diseases of the oral cavity and interact with microbiomes from other parts of the human body (in particular, the intestinal tract), but little is known about normal variation in the salivary microbiome. We analyzed 14,115 partial ( approximately 500 bp) 16S ribosomal RNA (rRNA) sequences from saliva samples from 120 healthy individuals (10 individuals from each of 12 worldwide locations). These sequences could be assigned to 101 known bacterial genera, of which 39 were not previously reported from the human oral cavity; phylogenetic analysis suggests that an additional 64 unknown genera are present. There is high diversity in the salivary microbiome within and between individuals, but little geographic structure. Overall, approximately 13.5% of the total variance in the composition of genera is due to differences among individuals, which is remarkably similar to the fraction of the total variance in neutral genetic markers that can be attributed to differences among human populations. Investigation of some environmental variables revealed a significant association between the genetic distances among locations and the distance of each location from the equator. Further characterization of the enormous diversity revealed here in the human salivary microbiome will aid in elucidating the role it plays in human health and disease, and in the identification of potentially informative species for studies of human population history.
Figures
Figure 1.
Map of the sampling locations. Ten saliva samples were obtained from each of the 12 sampling locations, for a total of 120 saliva samples analyzed.
Figure 2.
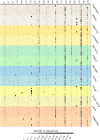
Heat plot of the abundance of each bacterial genus in each individual, based on the partial 16S rRNA sequences. Each horizontal row corresponds to an individual saliva sample, with different colored shadings indicating the 10 individuals from each sampling location, and sampling locations from the same broad geographic region indicated by similar colors. Each column is a genus, with the numbers corresponding to the genus, as in Supplemental Table S13. The abundance of each genus (columns) is indicated by the grayscale value, according to the scale at the bottom of the plot.
Figure 3.
Frequency distribution of the probability that two sequences will be assigned to different genera when drawn from the same individual (values are for each of the 120 individuals); different individuals from the same location (values are for all pairwise comparisons of the 10 individuals from the same location, for all 12 locations); and different individuals from different locations (values are for all pairwise comparisons of the 12 locations).
Figure 4.
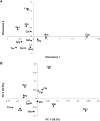
Graphical depictions of the relationships among sampling locations based on the partial 16S rRNA sequences. (A) MDS plot, based on linearized _F_ST distances (Slatkin 1995) between each pair of locations, calculated from the genus composition. The location abbreviations are as in Table 1. The stress value is 0.03. (B) PCA plot, based on the UniFrac distances (Lozupone and Knight 2005); same abbreviations as in A. The percentage of the total variance explained by each PC is indicated in parentheses.
Figure 5.
Amount of variation explained (in percent) in the _F_ST distances among individuals (for the age and gender of the donors), and in the UniFrac distances among locations (for the variables population size, distance from the equator, average annual temperature, and average annual rainfall) (Supplemental Table S15). There is a significant association between the UniFrac distances and the variable “Distance from Equator” (P = 0.006).
References
- Anderson M.J. A new method for non-parametric multivariate analysis of variance. Austral Ecol. 2001;26:32–46.
- Anderson M.J. DISTLM v.5: A FORTRAN computer program to calculate a distance-based multivariate analysis for a linear model. Department of Statistics, University of Auckland; New Zealand: 2004.
Publication types
MeSH terms
Substances
LinkOut - more resources
Full Text Sources
Molecular Biology Databases


