Genomic distribution of CHD7 on chromatin tracks H3K4 methylation patterns - PubMed (original) (raw)
. 2009 Apr;19(4):590-601.
doi: 10.1101/gr.086983.108. Epub 2009 Feb 27.
Cynthia F Bartels, Kuntal Shastri, Dheepa Balasubramanian, Gabriel E Zentner, Ravishankar Balaji, Xiaodong Zhang, Lingyun Song, Zhenghe Wang, Thomas Laframboise, Gregory E Crawford, Peter C Scacheri
Affiliations
- PMID: 19251738
- PMCID: PMC2665778
- DOI: 10.1101/gr.086983.108
Genomic distribution of CHD7 on chromatin tracks H3K4 methylation patterns
Michael P Schnetz et al. Genome Res. 2009 Apr.
Abstract
CHD7 is a member of the chromodomain helicase DNA binding domain family of ATP-dependent chromatin remodeling enzymes. De novo mutation of the CHD7 gene is a major cause of CHARGE syndrome, a genetic disease characterized by a complex constellation of birth defects (Coloboma of the eye, Heart defects, Atresia of the choanae, severe Retardation of growth and development, Genital abnormalities, and Ear abnormalities). To gain insight into the function of CHD7, we mapped the distribution of the CHD7 protein on chromatin using the approach of chromatin immunoprecipitation on tiled microarrays (ChIP-chip). These studies were performed in human colorectal carcinoma cells, human neuroblastoma cells, and mouse embryonic stem (ES) cells before and after differentiation into neural precursor cells. The results indicate that CHD7 localizes to discrete locations along chromatin that are specific to each cell type, and that the cell-specific binding of CHD7 correlates with a subset of histone H3 methylated at lysine 4 (H3K4me). The CHD7 sites change concomitantly with H3K4me patterns during ES cell differentiation, suggesting that H3K4me is part of the epigenetic signature that defines lineage-specific association of CHD7 with specific sites on chromatin. Furthermore, the CHD7 sites are predominantly located distal to transcription start sites, most often contained within DNase hypersensitive sites, frequently conserved, and near genes expressed at relatively high levels. These features are similar to those of gene enhancer elements, raising the possibility that CHD7 functions in enhancer mediated transcription, and that the congenital anomalies in CHARGE syndrome are due to alterations in transcription of tissue-specific genes normally regulated by CHD7 during development.
Figures
Figure 1.
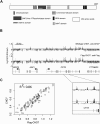
CHD7 binds to specific sites on chromatin. (A) Structure of CHD7. (B) ChIP-chip analysis of wild-type and Flag-tagged CHD7 in DLD1 cells. CHD7 binding profiles from a 500-kb region on chromosome 7. Median raw ratio data of three biological replicates from the indicated ChIP-Chip experiments are plotted, along with the relative locations of known genes and their transcriptional orientation (arrows). The top 5% is displayed as a horizontal gray line. An expanded view of three positive signals along the CFTR gene is shown below. (C) The maximum signal intensity ratios for each CHD7 occupied site in CHD7 and Flag ChIP-chip experiments are plotted on the _y_- and _x_-axes, respectively (n = 96).
Figure 2.
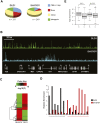
CHD7 overlaps with a subset of regions known to harbor regulatory elements. (A) Regulatory elements were mapped using the approach of DNase-chip (red), and compared to CHD7 sites mapped by ChIP-chip (black). Median smoothed raw ratio data are displayed. Note that most of the CHD7 binding sites are contained within DNase I hypersensitive sites (red arrows), but not vice-versa (black arrows). (B) Venn diagram depicting the overlap between high confidence (P ≤ 1 × 10⁻¹²) CHD7 (green) and DNase-HS sites (pink) across the ENCODE regions.
Figure 3.
Characterization of CHD7 sites in DLD1 and SH-SY5Y cells. (A) Pie charts showing the distribution of CHD7 sites relative to GENCODE genes. (B) CHD7 ChIP-chip profiles from DLD1 and SH-SY5Y cells along ENCODE region ENm001. Raw ratio data are plotted. (C) Plotted in the heat map are _P_-values corresponding to signal intensities of all CHD7 sites identified by ChIP-chip in DLD1 and SH-SY5Y cells. (D) Confirmatory ChIP-PCR of CHD7 sites unique to DLD1 cells (underlined in black), and 8 CHD7 sites unique to SH-SY5Y cells (underlined in red). (E) Average expression of genes within 10 kb of a CHD7 site (B) and greater than 10 kb from a CHD7 site (U) in DLD1 and SH-SY5Y cells. The asterisk denotes significant differences as determined by Wilcoxon test (DLD1 P = 0.00005, SH-SY5Y P = 0.03).
Figure 4.
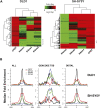
Comparison of CHD7 and H3K4 methylation patterns. (A) Heat maps illustrating the overlap of CHD7 and K4 mono-, di-, and trimethylation across 6 ENCODE regions (left) in DLD1 cells and all 44 ENCODE regions in SH-SY5Y cells (right), respectively. The regions denoted by the side brackets harbor low levels of H3K4me1 that are apparent at lower significance thresholds. (B) Aggregate plots of ChIP-chip signals. Raw ChIP-chip data from each cell line were quantile normalized. The median signal intensity of CHD7 peaks (from −5 to +5 kb with respect to the center of the peak) was then calculated and plotted, along with signal intensities for mono-, di-, and trimethyl K4 at the equivalent regions in both DLD1 (top left) and SH-SY5Y cells (bottom left). This was repeated for CHD7 sites located at GENCODE transcription start sites (center) and distal CHD7 sites (right).
Figure 5.
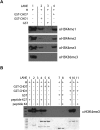
In vitro binding of CHD7 chromodomains to methylated H3K4. (A) Histone pulldown assays were performed using purified GST, GST-CHD7, and GST-CHD1 fusion proteins and purified histones (H) containing all possible covalent modifications. Bound proteins were analyzed by SDS-PAGE and Western blotting with the indicated antibodies. Lane 1 corresponds to input. (B, top) Peptide competition assay in which purified histones (H) were incubated with either H3K4me3 peptide (peptide K4) or H3K27me3 peptide (peptide K27) prior to incubating with indicated GST proteins. Pulldowns were performed with GST beads, and bound proteins were analyzed by SDS-PAGE and Western blotting with H3K4me3 antibody. Similar results were obtained with H3K4me1 and H3K4me2 peptides and antibodies (data not shown). Lanes 1–3 are input. A Coomassie-stained gel showing the purified GST proteins is shown on the bottom. The asterisk denotes a nonspecific band.
Figure 6.
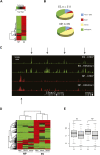
Characterization of CHD7 sites in ES and NP cells. (A) Heat map of _P_-values corresponding to CHD7 ChIP-chip signal intensities in ES and NP cells. (B) Pie charts showing distribution of CHD7 sites with respect to RefSeq genes in regions of the mouse genome that are orthologous to the human ENCODE regions. (C) CHD7 and H3K4me1 ChIP-chip profiles in ES and NP cells. (D) Heat map of _P_-values corresponding to CHD7, H3K4me1, and H3K4me2 ChIP-chip signals in ES and NP cells. (E) Average expression of genes within 10 kb of a CHD7 site (B) and greater than 10 kb from a CHD7 site (U) in ES and NP cells. The asterisk denotes significant differences as determined by Wilcoxon test (ES P = 0.03, NP P = 0.02).
Figure 7.
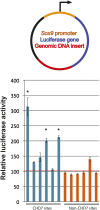
Analysis of CHD7 sites in reporter assays. (Top) Genomic fragments (red) were cloned downstream from the luciferase gene (blue) driven by the minimal Sox9 promoter (orange). (Bottom) Compared to cells transfected with constructs containing genomic inserts devoid of CHD7 binding in DLD1 cells (non-CHD7 sites, orange bars), 3/6 constructs containing CHD7 sites (blue bars) show significant increases in luciferase activity when transfected into DLD1 cells. The asterisks denote significance as determined by two-tailed _t_-tests. The red horizontal line denotes the average of the non-CHD7 sites.
Similar articles
- CHD7 targets active gene enhancer elements to modulate ES cell-specific gene expression.
Schnetz MP, Handoko L, Akhtar-Zaidi B, Bartels CF, Pereira CF, Fisher AG, Adams DJ, Flicek P, Crawford GE, Laframboise T, Tesar P, Wei CL, Scacheri PC. Schnetz MP, et al. PLoS Genet. 2010 Jul 15;6(7):e1001023. doi: 10.1371/journal.pgen.1001023. PLoS Genet. 2010. PMID: 20657823 Free PMC article. - CHD7 cooperates with PBAF to control multipotent neural crest formation.
Bajpai R, Chen DA, Rada-Iglesias A, Zhang J, Xiong Y, Helms J, Chang CP, Zhao Y, Swigut T, Wysocka J. Bajpai R, et al. Nature. 2010 Feb 18;463(7283):958-62. doi: 10.1038/nature08733. Epub 2010 Feb 3. Nature. 2010. PMID: 20130577 Free PMC article. - CHD7 regulates cardiovascular development through ATP-dependent and -independent activities.
Yan S, Thienthanasit R, Chen D, Engelen E, Brühl J, Crossman DK, Kesterson R, Wang Q, Bouazoune K, Jiao K. Yan S, et al. Proc Natl Acad Sci U S A. 2020 Nov 17;117(46):28847-28858. doi: 10.1073/pnas.2005222117. Epub 2020 Oct 30. Proc Natl Acad Sci U S A. 2020. PMID: 33127760 Free PMC article. - Molecular and phenotypic aspects of CHD7 mutation in CHARGE syndrome.
Zentner GE, Layman WS, Martin DM, Scacheri PC. Zentner GE, et al. Am J Med Genet A. 2010 Mar;152A(3):674-86. doi: 10.1002/ajmg.a.33323. Am J Med Genet A. 2010. PMID: 20186815 Free PMC article. Review. - Congenital heart defects in CHARGE: The molecular role of CHD7 and effects on cardiac phenotype and clinical outcomes.
Meisner JK, Martin DM. Meisner JK, et al. Am J Med Genet C Semin Med Genet. 2020 Mar;184(1):81-89. doi: 10.1002/ajmg.c.31761. Epub 2019 Dec 13. Am J Med Genet C Semin Med Genet. 2020. PMID: 31833191 Free PMC article. Review.
Cited by
- Role of Chd7 in zebrafish: a model for CHARGE syndrome.
Patten SA, Jacobs-McDaniels NL, Zaouter C, Drapeau P, Albertson RC, Moldovan F. Patten SA, et al. PLoS One. 2012;7(2):e31650. doi: 10.1371/journal.pone.0031650. Epub 2012 Feb 20. PLoS One. 2012. PMID: 22363697 Free PMC article. - MicroRNAs and epigenetic regulation in the mammalian inner ear: implications for deafness.
Friedman LM, Avraham KB. Friedman LM, et al. Mamm Genome. 2009 Sep-Oct;20(9-10):581-603. doi: 10.1007/s00335-009-9230-5. Epub 2009 Oct 30. Mamm Genome. 2009. PMID: 19876605 Review. - Etiology of esophageal atresia and tracheoesophageal fistula: "mind the gap".
de Jong EM, Felix JF, de Klein A, Tibboel D. de Jong EM, et al. Curr Gastroenterol Rep. 2010 Jun;12(3):215-22. doi: 10.1007/s11894-010-0108-1. Curr Gastroenterol Rep. 2010. PMID: 20425471 Free PMC article. Review. - Stem Cell Proliferation Is Kept in Check by the Chromatin Regulators Kismet/CHD7/CHD8 and Trr/MLL3/4.
Gervais L, van den Beek M, Josserand M, Sallé J, Stefanutti M, Perdigoto CN, Skorski P, Mazouni K, Marshall OJ, Brand AH, Schweisguth F, Bardin AJ. Gervais L, et al. Dev Cell. 2019 May 20;49(4):556-573.e6. doi: 10.1016/j.devcel.2019.04.033. Dev Cell. 2019. PMID: 31112698 Free PMC article. - Chromatin and oxygen sensing in the context of JmjC histone demethylases.
Shmakova A, Batie M, Druker J, Rocha S. Shmakova A, et al. Biochem J. 2014 Sep 15;462(3):385-95. doi: 10.1042/BJ20140754. Biochem J. 2014. PMID: 25145438 Free PMC article. Review.
References
- Aramaki M., Udaka T., Kosaki R., Makita Y., OkamAto N., Yoshihashi H., Oki H., Nanao K., Moriyama N., Oku S., et al. Phenotypic spectrum of CHARGE syndrome with CHD7 mutations. J. Pediatr. 2006;148:410–414. - PubMed
- Barski A., Cuddapah S., Cui K., Roh T.Y., Schones D.E., Wang Z., Wei G., Chepelev I., Zhao K. High-resolution profiling of histone methylations in the human genome. Cell. 2007;129:823–837. - PubMed
- Blake K.D., Davenport S.L., Hall B.D., Hefner M.A., Pagon R.A., Williams M.S., Lin A.E., Graham J.M., Jr CHARGE association: An update and review for the primary pediatrician. Clin. Pediatr. (Phila.) 1998;37:159–173. - PubMed
- Blanchette M., Bataille A.R., Chen X., Poitras C., Laganiere J., Lefebvre C., Deblois G., Giguere V., Ferretti V., Bergeron D., et al. Genome-wide computational prediction of transcriptional regulatory modules reveals new insights into human gene expression. Genome Res. 2006;16:656–668. - PMC - PubMed
- Bosman E.A., Penn A.C., Ambrose J.C., Kettleborough R., Stemple D.L., Steel K.P. Multiple mutations in mouse Chd7 provide models for CHARGE syndrome. Hum. Mol. Genet. 2005;14:3463–3476. - PubMed
Publication types
MeSH terms
Substances
Grants and funding
- KCA103843/PHS HHS/United States
- T32HD007104/HD/NICHD NIH HHS/United States
- R01HG004722/HG/NHGRI NIH HHS/United States
- R01HD056369/HD/NICHD NIH HHS/United States
- R01 HD056369-02/HD/NICHD NIH HHS/United States
- R01 HD056369/HD/NICHD NIH HHS/United States
- R01 HG004722/HG/NHGRI NIH HHS/United States
- K22 CA103843/CA/NCI NIH HHS/United States
- T32 HD007104/HD/NICHD NIH HHS/United States
LinkOut - more resources
Full Text Sources
Other Literature Sources
Molecular Biology Databases
