Comparative functional analysis of the Caenorhabditis elegans and Drosophila melanogaster proteomes - PubMed (original) (raw)
Comparative Study
doi: 10.1371/journal.pbio.1000048.
Manuel Weiss, Lukas Reiter, Christian H Ahrens, Marko Jovanovic, Johan Malmström, Erich Brunner, Sonali Mohanty, Martin J Lercher, Peter E Hunziker, Ruedi Aebersold, Christian von Mering, Michael O Hengartner
Affiliations
- PMID: 19260763
- PMCID: PMC2650730
- DOI: 10.1371/journal.pbio.1000048
Comparative Study
Comparative functional analysis of the Caenorhabditis elegans and Drosophila melanogaster proteomes
Sabine P Schrimpf et al. PLoS Biol. 2009.
Abstract
The nematode Caenorhabditis elegans is a popular model system in genetics, not least because a majority of human disease genes are conserved in C. elegans. To generate a comprehensive inventory of its expressed proteome, we performed extensive shotgun proteomics and identified more than half of all predicted C. elegans proteins. This allowed us to confirm and extend genome annotations, characterize the role of operons in C. elegans, and semiquantitatively infer abundance levels for thousands of proteins. Furthermore, for the first time to our knowledge, we were able to compare two animal proteomes (C. elegans and Drosophila melanogaster). We found that the abundances of orthologous proteins in metazoans correlate remarkably well, better than protein abundance versus transcript abundance within each organism or transcript abundances across organisms; this suggests that changes in transcript abundance may have been partially offset during evolution by opposing changes in protein abundance.
Conflict of interest statement
Competing interests. The authors have declared that no competing interests exist.
Figures
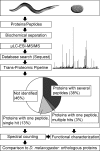
Figure 1. Workflow of the C. elegans Proteome Analysis
Proteins and peptides were isolated from whole worm or egg homogenates, and separated biochemically. Peptides were identified by μLC-ESI-MS/MS and database searches, and validated using the Trans-Proteomic Pipeline [62]. We detected peptides for 10,631 different gene loci, which corresponds to 54% of the predicted gene loci in WormBase WS140 (19,735 gene loci). For 7,476 gene loci, more than one peptide was identified; for 580 gene loci, a single peptide was identified independently multiple times; for 2,575 gene loci, a single peptide was identified; and 9,104 gene loci were not covered at all.
Figure 2. Classification of Detected Proteins
(A–C) A bias analysis of the 10,977 identified proteins (including splice variants) in comparison to the 22,269 predicted proteins in WormBase (WS140) was performed for the parameters (A) length, (B) isoelectric point (pI), and (C) hydrophobicity. Red lines indicate the percentages of identified proteins in comparison to all C. elegans proteins in each bin. A value below 49% indicates fewer detections than expected; a value above 49% indicates more detections than expected. (D and E) Over- and underrepresentations of transmembrane (TM) proteins (D) and their functional classes (E) in our experimental dataset. Statistically significant categories are labeled with asterisks: _p-_values better than 0.05 are indicated by a single asterisk (*); _p_-values better than 1E−4 are indicated by double asterisks (**). The proportion of proteins with transmembrane helices was 36.5% in WormBase, and 30.5% in our proteome dataset. (F) The global functional GO slim analysis for all proteins showed statistically significant over- or underrepresentations in the categories “biological process,” “cellular component,” and “molecular function.” We used abbreviated terms for three categories (GO:0006139, GO:0008152, and GO:0005488).
Figure 3. Improved Genome Annotation via Novel Peptide Identifications
Examples of novel peptides obtained from genomic searches against a six-frame translation of the C. elegans genome, and the region where they match to the genome. (A) The novel peptide sequence LFEMHQISGINAASPEK suggests an alternative translational start site for the protein SYN-4 (T01B11.3). The sequence predicted to code for this peptide extends upstream of the annotated translational start site. An alternative start codon can be found further upstream in the same reading frame. (B) A peptide points at a novel splice variant that was identified for the gene F47B7.7. The peptide WGDAGYVSHSPSPTGEIHEEYQYTR extends an existing annotated exon into the downstream intron, resulting either in the selection of an alternative 5′ splice site downstream of the peptide, or in intron retention, which would result in an early translation stop (shown).
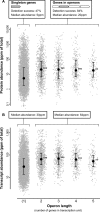
Figure 4. Operon Genes Are More Highly Expressed Than Singleton Genes
(A) Proteins whose genes are organized in operons were identified more frequently (84%) and more abundantly (median expression: 20 ppm) compared to proteins encoded by individually transcribed genes (47%; 5 ppm). _p-_values: double asterisks (**) indicate better than 1E−10; triple asterisks (***) indicate better than 1E−15. (B) A similar result is obtained when analyzing Affymetrix data instead (albeit with a smaller abundance difference). In both panels, the left-most data column encompasses singleton genes (i.e., not in operons), and the four columns to the right encompass genes in operons of various lengths. Medians are indicated as black dots, and whiskers encompass the range from 25% to 75% of values.
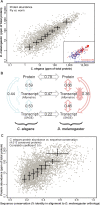
Figure 5. Interspecies Comparative Proteomics of Orthologous Proteins in C. elegans and D. melanogaster
(A) Protein abundances deduced from spectral counting of 2,695 pairs of orthologs from both species are shown. Medians of equal-sized bins are indicated as crosses; whiskers encompass the range from 25% to 75% of values. The distribution of the orthologs (dots) is indicated in the background. The distribution and correlation coefficients of proteins involved in signal transduction and translation are shown in the inset. (B) The correlation coefficient of RS = 0.79 between the two species is higher than that of the comparison between protein and transcript abundance within the organisms, based on SAGE or Affymetrix data. (C) For C. elegans, we plotted protein abundance versus sequence conservation (the latter determined by alignment with the D. melanogaster orthologs). All correlation coefficients are rank-based with _p-_values better than 2.2E−16.
Similar articles
- The Drosophila melanogaster flightless-I gene involved in gastrulation and muscle degeneration encodes gelsolin-like and leucine-rich repeat domains and is conserved in Caenorhabditis elegans and humans.
Campbell HD, Schimansky T, Claudianos C, Ozsarac N, Kasprzak AB, Cotsell JN, Young IG, de Couet HG, Miklos GL. Campbell HD, et al. Proc Natl Acad Sci U S A. 1993 Dec 1;90(23):11386-90. doi: 10.1073/pnas.90.23.11386. Proc Natl Acad Sci U S A. 1993. PMID: 8248259 Free PMC article. - The immunoglobulin superfamily in Drosophila melanogaster and Caenorhabditis elegans and the evolution of complexity.
Vogel C, Teichmann SA, Chothia C. Vogel C, et al. Development. 2003 Dec;130(25):6317-28. doi: 10.1242/dev.00848. Development. 2003. PMID: 14623821 - Relative contributions of intrinsic structural-functional constraints and translation rate to the evolution of protein-coding genes.
Wolf YI, Gopich IV, Lipman DJ, Koonin EV. Wolf YI, et al. Genome Biol Evol. 2010 Jul 12;2:190-9. doi: 10.1093/gbe/evq010. Genome Biol Evol. 2010. PMID: 20624725 Free PMC article. - Functional genomics of ionotropic acetylcholine receptors in Caenorhabditis elegans and Drosophila melanogaster.
Sattelle DB, Culetto E, Grauso M, Raymond V, Franks CJ, Towers P. Sattelle DB, et al. Novartis Found Symp. 2002;245:240-57; discussion 257-60, 261-4. Novartis Found Symp. 2002. PMID: 12027012 Review. - An overview of the insulin signaling pathway in model organisms Drosophila melanogaster and Caenorhabditis elegans.
Biglou SG, Bendena WG, Chin-Sang I. Biglou SG, et al. Peptides. 2021 Nov;145:170640. doi: 10.1016/j.peptides.2021.170640. Epub 2021 Aug 24. Peptides. 2021. PMID: 34450203 Review.
Cited by
- Insights into the regulation of protein abundance from proteomic and transcriptomic analyses.
Vogel C, Marcotte EM. Vogel C, et al. Nat Rev Genet. 2012 Mar 13;13(4):227-32. doi: 10.1038/nrg3185. Nat Rev Genet. 2012. PMID: 22411467 Free PMC article. Review. - PaxDb, a database of protein abundance averages across all three domains of life.
Wang M, Weiss M, Simonovic M, Haertinger G, Schrimpf SP, Hengartner MO, von Mering C. Wang M, et al. Mol Cell Proteomics. 2012 Aug;11(8):492-500. doi: 10.1074/mcp.O111.014704. Epub 2012 Apr 24. Mol Cell Proteomics. 2012. PMID: 22535208 Free PMC article. - Methods and strategies for gene structure curation in WormBase.
Williams GW, Davis PA, Rogers AS, Bieri T, Ozersky P, Spieth J. Williams GW, et al. Database (Oxford). 2011 May 3;2011:baq039. doi: 10.1093/database/baq039. Print 2011. Database (Oxford). 2011. PMID: 21543339 Free PMC article. - mRBPome capture identifies the RNA-binding protein TRIM71, an essential regulator of spermatogonial differentiation.
Du G, Wang X, Luo M, Xu W, Zhou T, Wang M, Yu L, Li L, Cai L, Wang PJ, Zhong Li J, Oatley JM, Wu X. Du G, et al. Development. 2020 Apr 12;147(8):dev184655. doi: 10.1242/dev.184655. Development. 2020. PMID: 32188631 Free PMC article. - Generic comparison of protein inference engines.
Claassen M, Reiter L, Hengartner MO, Buhmann JM, Aebersold R. Claassen M, et al. Mol Cell Proteomics. 2012 Apr;11(4):O110.007088. doi: 10.1074/mcp.O110.007088. Epub 2011 Nov 4. Mol Cell Proteomics. 2012. PMID: 22057310 Free PMC article.
References
- O'Brien KP, Westerlund I, Sonnhammer EL. OrthoDisease: a database of human disease orthologs. Hum Mutat. 2004;24:112–119. - PubMed
- C. elegans Sequencing Consortium. Genome sequence of the nematode C. elegans: a platform for investigating biology. Science. 1998;282:2012–2018. - PubMed
- Anderson L, Seilhamer J. A comparison of selected mRNA and protein abundances in human liver. Electrophoresis. 1997;18:533–537. - PubMed
Publication types
MeSH terms
Substances
LinkOut - more resources
Full Text Sources
Other Literature Sources
Molecular Biology Databases


