Hypoxia-induced autophagy is mediated through hypoxia-inducible factor induction of BNIP3 and BNIP3L via their BH3 domains - PubMed (original) (raw)
Hypoxia-induced autophagy is mediated through hypoxia-inducible factor induction of BNIP3 and BNIP3L via their BH3 domains
Grégory Bellot et al. Mol Cell Biol. 2009 May.
Abstract
While hypoxia-inducible factor (HIF) is a major actor in the cell survival response to hypoxia, HIF also is associated with cell death. Several studies implicate the HIF-induced putative BH3-only proapoptotic genes bnip3 and bnip3l in hypoxia-mediated cell death. We, like others, do not support this assertion. Here, we clearly demonstrate that the hypoxic microenvironment contributes to survival rather than cell death by inducing autophagy. The ablation of Beclin1, a major actor of autophagy, enhances cell death under hypoxic conditions. In addition, the ablation of BNIP3 and/or BNIP3L triggers cell death, and BNIP3 and BNIP3L are crucial for hypoxia-induced autophagy. First, while the small interfering RNA-mediated ablation of either BNIP3 or BNIP3L has little effect on autophagy, the combined silencing of these two HIF targets suppresses hypoxia-mediated autophagy. Second, the ectopic expression of both BNIP3 and BNIP3L in normoxia activates autophagy. Third, 20-mer BH3 peptides of BNIP3 or BNIP3L are sufficient in initiating autophagy in normoxia. Herein, we propose a model in which the atypical BH3 domains of hypoxia-induced BNIP3/BNIP3L have been designed to induce autophagy by disrupting the Bcl-2-Beclin1 complex without inducing cell death. Hypoxia-induced autophagy via BNIP3 and BNIP3L is clearly a survival mechanism that promotes tumor progression.
Figures
FIG. 1.
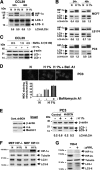
Hypoxia induces autophagy in an HIF-dependent manner in normal and cancer cell lines. (A) Conversion of LC3-I to LC3-II in CCL39 cells subjected to 24 and 48 h of hypoxia (H 1%) compared to that of cells in normoxia (N). Total cellular extracts were analyzed by immunoblotting with antibodies against HIF-1α and LC3. The LC3-I and LC3-II bands were quantified, and autophagy was reported as a variation in the ratio of LC3-II/LC3-I for each condition. n.s., nonspecific. (B) Conversion of LC3-I to LC3-II in MCF7, LS174, and PC3 cells subjected to 24 and 48 h of hypoxia for the indicated times. Total cell extracts were analyzed by immunoblotting with antibodies against HIF-1α and LC3. (C) Accumulation of LC3-II in the presence of bafilomycin A1 (Bafilo. A1) in CCL39 cells. CCL39 cells were incubated in hypoxia (24 h) and treated with bafilomycin A1 (10 nM for 1 or 4 h) prior to the end of hypoxic treatment. Total cellular extracts were analyzed by immunoblotting with antibodies against LC3. β-Actin was used as a control. (D) MDC staining of PC3 cells. PC3 cells were treated for 48 h in normoxia or hypoxia in the absence (− bafilomycin A1) or presence (+ bafilomycin A1) of bafilomycin A1 (1 nM for 48 h), and during the last hour 0.1 μM MDC was added. The quantification of MDC-stained structures was performed using the analyze particles tool of the Image J software on an average of 100 cells per treatment. Baf. A1, bafilomycin A1. (E) Ablation of Beclin1 totally suppresses hypoxia-induced autophagy. The inset shows the ablation of Beclin1 with a shBeclin1 lentivirus. Cont., control. PC3 cells were infected with shBCN. Total cell extracts were analyzed by immunoblotting with antibodies against Beclin1. β-Actin was used as a control. For immunoblotting, PC3 control and shBCN cells were subjected to either normoxia or hypoxia (48 h). Total cell extracts were analyzed by immunoblotting with antibodies against LC3. β-Actin was used as a control. (F) Knockout of HIF-1α suppresses hypoxia-induced autophagy. MEFs derived from wild-type (HIF+/+) and HIF-1α knockout embryos (HIF−/−) were subjected to either normoxia or hypoxia (48 h). Total cell extracts were analyzed by immunoblotting with antibodies against HIF-1α and LC3. Tubulin was used as a control. (G) Suppression of HIF-2α totally represses hypoxia-induced autophagy. Total cell extracts of renal clear cell carcinoma 786-O cells not expressing pVHL (−) or expressing pVHL (+) in normoxia were analyzed by immunoblotting with antibodies against HIF-1α, HIF-2α, and LC3. Tubulin was used as a control.
FIG. 2.
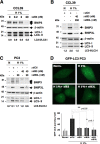
Silencing of BNIP3 and BNIP3L strongly affects the autophagic status of CCL39 and PC3 cells in hypoxia. (A) Specific silencing of BNIP3 in a dose-dependent manner using siRNA did not impact the conversion of LC3-I to LC3-II in CCL39 cells. Cell extracts were prepared from cells incubated in hypoxia (H 1%) 48 h after transfection with siRNA to BNIP3 (from 0.2 to 20 nM). Total cellular extracts were analyzed by immunoblotting with antibodies against BNIP3 and LC3. β-Actin was used as a control. siB3, siRNA to BNIP3. (B) Silencing of both BNIP3 and BNIP3L alters hypoxia-induced autophagy in CCL39 cells. Cells were transfected once with siRNA to BNIP3L (200 nM) and BNIP3 (40 nM), each alone or in combination, and maintained in normoxia or hypoxia for the last 48 h. Total cell extracts were analyzed by immunoblotting with antibodies against BNIP3, BNIP3L, and LC3. sictl, siRNA to SIMA; siB3L, siRNA to BNIP3L. (C) Silencing of both BNIP3 and BNIP3L alters hypoxia-induced autophagy in PC3 cells. PC3 cells were transfected once with siRNA to BNIP3L (20 nmol/liter) and BNIP3 (40 nmol/liter), each alone or in combination, and maintained in normoxia or hypoxia for the last 48 h. Total cellular extracts were analyzed by immunoblotting with antibodies against BNIP3, BNIP3L, and LC3. Two independent sets of siRNA to BNIP3 and BNIP3L were used. Experiments were done at least twice. Results are from one representative experiment. The band intensities of endogenous LC3-I and LC3-II were quantified, and the LC3-II/LC3-I ratio is indicated. (D) Silencing of BNIP3 and BNIP3L alters hypoxia-induced autophagy in stable GFP-LC3 PC3 cells. PC3 cells were transfected once with siRNA to BNIP3L (20 nmol/liter) and BNIP3 (40 nmol/liter), each alone or in combination, and maintained in normoxia or hypoxia for the last 48 h. An example of GFP-LC3 punctate structures observed in PC3 cells under normoxic and hypoxic conditions is shown. GFP fluorescence was examined under a Zeiss fluorescence microscope. The quantification of the number of GFP aggregates per cell was performed using the analyze particles command in the Image J software. *, P < 0.00001.
FIG. 3.
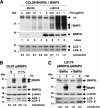
Overexpression of BNIP3 and BNIP3L strongly affects the autophagic status of CCL39, DLD1, and LS174 cells in normoxia. (A) Overexpression of BNIP3 and BNIP3L triggers autophagy in normoxia in CCL39-pBNIP3/BNIP3L cells. Cells were incubated in the absence (0 μg/ml) or presence (0.01, 0.1, or 1 μg/ml) of Tet for 4 days and maintained in the presence or absence of MG132 (5 μM) for the last 18 h. Total cell extracts were analyzed by immunoblotting with antibodies to BNIP3, BNIP3L, and LC3. (B) Combined BNIP3 and BNIP3L overexpression in DLD1-pBNIP3 cells did impact the conversion of LC3-I to LC3-II. DLD1-pBNIP3 cells were cultured in the absence (−) or presence (+) of Tet (10 μg/ml) for 4 days and maintained in either normoxia (N) or hypoxia (H 1%) for the last 24 h. Total cell extracts were analyzed by immunoblotting with antibodies against BNIP3, BNIP3L, and LC3. (C) BNIP3 and BNIP3L overexpression in combination in LS174-pBNIP3L/BNIP3 cells modified the conversion of LC3-I to LC3-II. LS174-pBNIP3L/BNIP3 clones were cultured in the absence (− Tet) or presence (+ Tet) of Tet (10 μg/ml) for 24 h. In the meantime, cells were cultured in the absence (− Bafilo) or presence (+ Bafilo) of bafilomycin A1 (1 nM) for the same 24 h. Total cell extracts were analyzed by immunoblotting with antibodies against BNIP3, BNIP3L, and LC3. The intensity of the bands of endogenous LC3-I and LC3-II was quantified, and the LC3-II/LC3-I ratio is indicated.
FIG. 4.
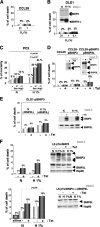
Blockade of autophagy in hypoxia triggers cell death through BNIP3. (A) Measurement of cell death in CCL39 cells. CCL39 cells were subjected to either normoxia (N) or hypoxia (H 1%) for 48 h before measuring cell death. (B) Measurement of cell death in DLD1 cells. Inset 1 shows the expression of BNIP3 and BNIP3L in DLD1 cells. The immunoblot shows DLD1 cells subjected to either normoxia (N) or hypoxia (H 1%) for 24 h. BNIP3 and BNIP3L expression was analyzed by immunoblotting. For the measurement of cell death, DLD1 cells were subjected to either normoxia (21% O2) or hypoxia (1 and 0.1% O2) for 48 h before measuring cell death. (C) Ablation of Beclin1 and ATG5 increase cell death in hypoxia. PC3 cells were transfected twice during a 24-h interval with siRNA to the control SIMA (40 nmol/liter), Beclin1 (40 nmol/liter), or ATG5 (40 nmol/liter), and cells were incubated for 48 h in hypoxia (H 1%) or normoxia (N). Beclin1 and ATG5 expression was analyzed by immunoblotting, and autophagy was examined. Two independent sets of siRNA to Beclin1 were used, but only one set of siRNA to ATG5 was used. Experiments were done at least twice. (D) Measurement of cell death in CCL39 clones overexpressing BNIP3/BNIP3L. CCL39 cells were incubated in the absence (−Tet) or presence (+Tet) of Tet (10 μg/ml) for 3 days before measuring cell death. Inset 2 shows the overexpression of BNIP3 in CCL39 cells. The immunoblot shows the overexpression of the BNIP3 protein in the presence of Tet. BNIP3 expression was analyzed by immunoblotting 3 days after Tet addition. The clone strongly expressed BNIP3 protein levels in normoxia. For the measurement of cell death, CCL39-pBNIP3 and CCL39-pBNIP3-BNIP3L clones were incubated in the absence (−Tet) or presence (+Tet) of Tet (10 μg/ml) for 3 days before measuring cell death. Inset 3 shows the overexpression of BNIP3 and BNIP3L in CCL39 cells. The immunoblot shows the stable overexpression of BNIP3L and the overexpression of the BNIP3 protein in the presence of Tet. BNIP3 expression was analyzed by immunoblotting 3 days after Tet addition. The clone strongly expressed BNIP3 and BNIP3L protein levels under normoxia. For cell death measurement, CCL39-pBNIP3-BNIP3L clones were incubated in the absence (−Tet) or presence (+Tet) of Tet (10 μg/ml) for 3 days before measuring cell death. (E) Measurement of cell death in Tet-induced BNIP3-expressing DLD1 cells. Inset 4 shows the expression of BNIP3 and BNIP3L in the DLD1 pBNIP3 clone. The immunoblot shows the DLD1 pBNIP3 clone incubated in the absence (−Tet) or presence (+Tet) of Tet (10 μg/ml) for 3 days before incubation for 24 h in hypoxia (1% O2). BNIP3 and BNIP3L expression was analyzed by immunoblotting. For the measurement of cell death, the DLD1 pBNIP3 clone was incubated in the absence (−Tet) or presence (+Tet) of Tet (10 μg/ml) for 3 days before incubation for 24 h in hypoxia (1% O2) before measuring cell death. (F) Ablation of BNIP3 increases cell death in normoxia and hypoxia. Inset 5 shows the effect of BNIP3 ablation. The immunoblot shows the ablation of BNIP3 in normoxia and hypoxia. LS pTerBNIP3 cells were incubated in the absence (−Tet) or presence (+Tet) of Tet (10 μg/ml) for 3 days before incubation for 48 h in hypoxia (H 1% O2). BNIP3 and BNIP3L expression was analyzed by immunoblotting. Hsp90 was used as a control. For the measurement of cell death, the LS pTerBNIP3 clone was incubated in the absence (−Tet) or presence (+Tet) of Tet (10 μg/ml) for 3 days before incubation in either normoxia (N) or hypoxia (H 1%) for 48 h. Inset 6 shows the effect of BNIP3 and BNIP3L ablation. The immunoblot shows the ablation of BNIP3L in normoxia and hypoxia in the absence of BNIP3 expression. The LS pTerBNIP3 clone was incubated in the absence (−Tet) or presence (+Tet) of Tet (10 μg/ml) for 3 days before transient transfection with siRNA to BNIP3L (40 nM). Cells then were subjected to normoxia (N) or hypoxia (H 1%) for 48 h. BNIP3 and BNIP3L expression was analyzed by immunoblotting. Hsp90 was used as a control. For the measurement of cell death, the LS pTerBNIP3 clone was incubated in the absence (−Tet) or presence (+Tet) of Tet (10 μg/ml) for 3 days before transient transfection with siRNA to BNIP3L (40 nM). An siRNA to SIMA (siSIMA; 40 nM) was used as a control. Cells then were subjected to normoxia (N) or hypoxia (H 1%) for 48 h before measuring cell death with trypan blue. Experiments were done in duplicate at least three times.
FIG. 5.
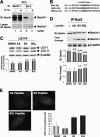
Hypoxia triggers autophagy in promoting survival. (A) Coimmunoprecipitation of endogenous Beclin1 with Bcl-2. PC3 cells were subjected to hypoxia (H 1%; 48 h), and cell lysates were immunoprecipitated with an anti-Beclin1 antibody resin. The presence of Beclin1 protein in the lysates and the immunoprecipitates is shown (arrow). IB, immunoblot; IP, immunoprecipitate. (B) Sequences of the three BH3 peptides used, BNIP3L, BNIP3, and a mutated form of BNIP3 (BNIP3 mut). The stretch of arginine residues (R8) and the glycine linker (G) are shown in italics, and the central core of the BH3 domain is in boldface. B3, R8 peptide of the BNIP3 BH3 domain; B3L, R8 peptide of the BNIP3L BH3 domain; AA, R8 peptide of the mutated BNIP3 BH3 domain. (C) R8-BH3 peptides of BNIP3 and BNIP3L trigger autophagy (i.e., an increase in the LC3-II/LC3-I ratio) in normoxia in LS174 cells. LS174 cells were exposed in complete medium three times during a 24-h period to 25 μg/ml of the R8-modified peptides in normoxia. Experiments were done twice in LS174 cells, giving identical results (results from one experiment are shown). In the two experiments, the addition of the mutated AA form gave results identical to those for dimethyl sulfoxide (DMSO) with no peptide. Total cell extracts were analyzed by immunoblotting with antibodies against LC3 and β-actin. (D) Disruption of the Bcl-2-Beclin1 complex by BH3 peptides derived from BNIP3 or BNIP3L. An acellular assay was performed with a normoxic lysate of PC3 cells incubated in the absence or presence of BNIP3 or BNIP3L peptide. The coimmunoprecipitation of endogenous Beclin1 was performed with an anti-Bcl-2 antibody. The presence of Beclin1 in the lysates and the immunoprecipitate is illustrated (arrow). (E) BNIP3 and BNIP3L peptides trigger autophagy in stable GFP-LC3-expressing PC3 cells. PC3 cells were infused five times with the AA (20 μM), BNIP3 (20 μM), or BNIP3L peptide (20 μM) for 24 h. An example of GFP-LC3 punctate structures observed in GFP-LC3 PC3 cells under normoxic and hypoxic conditions is given. GFP fluorescence was examined under a Zeiss fluorescence microscope. The quantification of the number of GFP aggregates per cell was performed using the analyze particles tool in the Image J software. *, P < 0.00001.
FIG. 6.
Hypothetical model of HIF-induced autophagy. In normoxia (left), Beclin1 forms low-affinity complexes with Bcl-XL and Bcl-2 via its BH3 domain, thereby decreasing the rate of autophagy. In hypoxia (right), the rapid induction of the BH3-only proteins (BNIP3 and BNIP3L) displaces Beclin1 from Bcl-XL and Bcl-2, leading to autophagy. The affinity of the BH3 domains of the BNIP proteins is too low to form tight complexes with Bcl-XL and Bcl-2. Therefore, BNIP3 and BNIP3L fail to induce cell death.
Similar articles
- BNIP3 subfamily BH3-only proteins: mitochondrial stress sensors in normal and pathological functions.
Chinnadurai G, Vijayalingam S, Gibson SB. Chinnadurai G, et al. Oncogene. 2008 Dec;27 Suppl 1(Suppl 1):S114-27. doi: 10.1038/onc.2009.49. Oncogene. 2008. PMID: 19641497 Free PMC article. Review. - Autophagy in cancer associated fibroblasts promotes tumor cell survival: Role of hypoxia, HIF1 induction and NFκB activation in the tumor stromal microenvironment.
Martinez-Outschoorn UE, Trimmer C, Lin Z, Whitaker-Menezes D, Chiavarina B, Zhou J, Wang C, Pavlides S, Martinez-Cantarin MP, Capozza F, Witkiewicz AK, Flomenberg N, Howell A, Pestell RG, Caro J, Lisanti MP, Sotgia F. Martinez-Outschoorn UE, et al. Cell Cycle. 2010 Sep 1;9(17):3515-33. doi: 10.4161/cc.9.17.12928. Epub 2010 Sep 9. Cell Cycle. 2010. PMID: 20855962 Free PMC article. - Hypoxia signals autophagy in tumor cells via AMPK activity, independent of HIF-1, BNIP3, and BNIP3L.
Papandreou I, Lim AL, Laderoute K, Denko NC. Papandreou I, et al. Cell Death Differ. 2008 Oct;15(10):1572-81. doi: 10.1038/cdd.2008.84. Epub 2008 Jun 13. Cell Death Differ. 2008. PMID: 18551130 - Atypical BH3-domains of BNIP3 and BNIP3L lead to autophagy in hypoxia.
Mazure NM, Pouysségur J. Mazure NM, et al. Autophagy. 2009 Aug;5(6):868-9. doi: 10.4161/auto.9042. Epub 2009 Aug 18. Autophagy. 2009. PMID: 19587545 - The role of the hypoxia-inducible BH3-only proteins BNIP3 and BNIP3L in cancer.
Mellor HR, Harris AL. Mellor HR, et al. Cancer Metastasis Rev. 2007 Dec;26(3-4):553-66. doi: 10.1007/s10555-007-9080-0. Cancer Metastasis Rev. 2007. PMID: 17805942 Review.
Cited by
- HIF-1α Metabolic Pathways in Human Cancer.
Elzakra N, Kim Y. Elzakra N, et al. Adv Exp Med Biol. 2021;1280:243-260. doi: 10.1007/978-3-030-51652-9_17. Adv Exp Med Biol. 2021. PMID: 33791987 Review. - Aquaglyceroporin-3's Expression and Cellular Localization Is Differentially Modulated by Hypoxia in Prostate Cancer Cell Lines.
de Almeida A, Parthimos D, Dew H, Smart O, Wiltshire M, Errington RJ. de Almeida A, et al. Cells. 2021 Apr 8;10(4):838. doi: 10.3390/cells10040838. Cells. 2021. PMID: 33917751 Free PMC article. - Cobalt chloride has beneficial effects across species through a hormetic mechanism.
Schiavi A, Runci A, Maiorino T, Naso FD, Barenys M, Fritsche E, Strappazzon F, Ventura N. Schiavi A, et al. Front Cell Dev Biol. 2022 Oct 25;10:986835. doi: 10.3389/fcell.2022.986835. eCollection 2022. Front Cell Dev Biol. 2022. PMID: 36393859 Free PMC article. - Mitochondrial network remodeling: an important feature of myogenesis and skeletal muscle regeneration.
Rahman FA, Quadrilatero J. Rahman FA, et al. Cell Mol Life Sci. 2021 May;78(10):4653-4675. doi: 10.1007/s00018-021-03807-9. Epub 2021 Mar 22. Cell Mol Life Sci. 2021. PMID: 33751143 Free PMC article. Review. - Peroxisome proliferator-activated receptor δ agonist, HPP593, prevents renal necrosis under chronic ischemia.
Fedorova LV, Sodhi K, Gatto-Weis C, Puri N, Hinds TD Jr, Shapiro JI, Malhotra D. Fedorova LV, et al. PLoS One. 2013 May 15;8(5):e64436. doi: 10.1371/journal.pone.0064436. Print 2013. PLoS One. 2013. PMID: 23691217 Free PMC article.
References
- Biederbick, A., H. F. Kern, and H. P. Elsasser. 1995. Monodansylcadaverine (MDC) is a specific in vivo marker for autophagic vacuoles. Eur. J. Cell Biol. 663-14. - PubMed
- Boyd, J. M., S. Malstrom, T. Subramanian, L. K. Venkatesh, U. Schaeper, B. Elangovan, C. D'Sa-Eipper, and G. Chinnadurai. 1994. Adenovirus E1B 19 kDa and Bcl-2 proteins interact with a common set of cellular proteins. Cell 79341-351. - PubMed
Publication types
MeSH terms
Substances
LinkOut - more resources
Full Text Sources
Other Literature Sources
Molecular Biology Databases
Miscellaneous
