Glucose effects on beta-cell growth and survival require activation of insulin receptors and insulin receptor substrate 2 - PubMed (original) (raw)
Glucose effects on beta-cell growth and survival require activation of insulin receptors and insulin receptor substrate 2
Anke Assmann et al. Mol Cell Biol. 2009 Jun.
Abstract
Insulin and insulin-like growth factor I (IGF-I) are ubiquitous hormones that regulate growth and metabolism of most mammalian cells, including pancreatic beta-cells. In addition to being an insulin secretagogue, glucose regulates proliferation and survival of beta-cells. However, it is unclear whether the latter effects of glucose occur secondary to autocrine activation of insulin signaling proteins by secreted insulin. To examine this possibility we studied the effects of exogenous glucose or insulin in beta-cell lines completely lacking either insulin receptors (betaIRKO) or insulin receptor substrate 2 (betaIRS2KO). Exogenous addition of either insulin or glucose activated proteins in the insulin signaling pathway in control beta-cell lines with the effects of insulin peaking earlier than glucose. Insulin stimulation of betaIRKO and betaIRS2KO cells led to blunted activation of phosphatidylinositol 3-kinase and Akt kinase, while surprisingly, glucose failed to activate either kinase but phosphorylated extracellular signal-regulated kinase. Control beta-cells exhibited low expression of IGF-1 receptors compared to compensatory upregulation in betaIRKO cells. The signaling data support the slow growth and reduced DNA and protein synthesis in betaIRKO and betaIRS2KO cells in response to glucose stimulation. Together, these studies provide compelling evidence that the growth and survival effects of glucose on beta-cells require activation of proteins in the insulin signaling pathway.
Figures
FIG. 1.
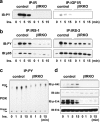
Insulin activates proteins in the insulin/IGF-1 signaling pathway in control β-cells, but not in βIRKO cells. Cells were stimulated with 100 nM insulin for 0, 1, 5, or 15 min. (a) Tyrosine phosphorylation of the insulin receptor and IGF-1 receptor. (b) Tyrosine phosphorylation of IRS-1 and IRS-2. The immunoprecipitates (IP) with anti-IR, anti-IRS-1, or anti-IRS-2 from the indicated cell lysates with or without insulin stimulation were immunoblotted (IB) with anti-PY (top panels) or the p85 antibody (bottom panels). (c) PI3K activity associated with the phosphotyrosine complex. PI3K activity was measured after immunoprecipitation with anti-PY from the indicated cell lysates. (d) Phosphorylation of Akt and ERK. The cell lysates were immunoblotted with the indicated antibodies. Representative blots are shown from three independent experiments.
FIG. 2.
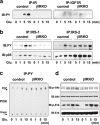
Glucose activates proteins in the insulin/IGF-1 signaling pathway in control β-cells, but not in βIRKO cells. Cells were treated with glucose (25 mM) for 0, 1, 5, or 15 min. (a) Tyrosine phosphorylation of the insulin receptor and IGF-1 receptor. (b) Tyrosine phosphorylation of IRS-1 and IRS-2. The immunoprecipitates (IP) with anti-IR, anti-IRS-1, or anti-IRS-2 from the indicated cell lysates with or without glucose stimulation were immunoblotted (IB) with anti-PY (top panels) or the p85 antibody (bottom panels). (c) PI3K activity associated with the phosphotyrosine complex. PI3K activity was measured in the immunoprecipitation with anti-PY from the indicated cell lysates. (d) Phosphorylation of Akt and ERK. The cell lysates were immunoblotted with the indicated antibodies. Representative blots are shown from three independent experiments.
FIG. 3.
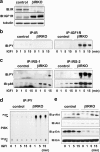
βIRKO cells exhibit a compensatory increase in expression of IGF-1 receptors. (a) To determine the presence and cross-reactivity of insulin and IGF-1 receptors we treated control β-cells with IGF-I (100 nM) and performed immunoprecipitation and blotting for either the insulin receptor or the IGF-1 receptor. For experiments in panels b to d, cells were treated with IGF-I (100 nM) for 0, 1, 5 or 15 min. (b) Tyrosine phosphorylation of insulin receptor (right panel) and IGF-1 receptor (left panel). (c) Tyrosine phosphorylation of IRS-1 and IRS-2. The immunoprecipitates (IP) with anti-IRS-1 or anti-IRS-2 from the indicated cell lysates with or without IGF-1 stimulation were immunoblotted (IB) with anti-PY (top panels) or the p85 antibody (bottom panels). (d) PI3K activity associated with the phosphotyrosine complex. PI3K activity was measured in the immunoprecipitation reaction with anti-PY from the indicated cell lysates. (e) Phosphorylation of Akt and ERK. The cell lysates were immunoblotted with the indicated antibodies. Representative blots are shown from three independent experiments.
FIG. 4.
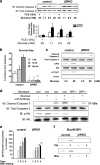
Insulin signaling protects β-cells from apoptosis and promotes growth. (a) Glucose protects β-cells from serum deprivation-induced apoptosis. Cells were cultured in the indicated glucose concentrations without serum for 24 h. The levels of apoptosis were assessed by determining the levels of cleaved caspase-3 by Western blotting (IB). Shown is a representative result from three independent experiments. Data (lower graph) for the changes are expressed as the ratio of cleaved caspase-3 to total caspase. *, P < 0.05 versus the respective control (FCS plus glucose). (b) Insulin protects β-cells from serum deprivation-induced apoptosis. Cells were cultured in the indicated concentration of insulin without serum for 24 h. The levels of apoptosis were assessed using an enzyme-linked immunosorbent assay for nucleosomal DNA as described in Materials and Methods. Data are expressed as the percentage of cells rescued from apoptosis. Data are from three independent experiments. (c) Glucose promotes activation of cleaved caspase-3 in βIRKO but not in control β-cells. Data are representative of three independent experiments. (d) Blocking the insulin receptor with anti-insulin receptor antibody enhances serum depletion-induced cleaved caspase-3 in control β-cells. Data are representative of three independent experiments. (e) Insulin or glucose stimulates p4E-BP1 in control but not βIRKO β-cells. Cells were stimulated with insulin (100 nM) or glucose (20 mM) for 30 min, and the cell lysates were subjected to immunoblotting (IB) with anti-p-4E-BP1. Data are representative of three independent experiments. (f) βIRKO β-cells exhibit significantly reduced [3H]thymidine incorporation compared to control β-cells over a 96-h incubation period. *, P < 0.05 versus the respective control (day 0); #, P < 0.05 for βIRKO versus control.
FIG. 5.
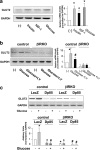
Glucose and insulin promote expression of GLUT2. (a) Insulin and glucose enhance expression of GLUT2. Cells were starved overnight and stimulated with insulin (100 nM), IGF-I (100 nM), or glucose (20 mM) for 12 h. The right panel shows the the data normalized to glyceraldehyde-3-phosphate dehydrogenase (GAPDH) levels. *, P < 0.05 for untreated versus insulin or IGF-I or glucose. Data are representative of three independent experiments. (b) Inhibition of PI3K blocks the effect of glucose on the expression of GLUT2. Cells were preincubated with 10 μM LY294002 for 30 min and stimulated with glucose (20 mM) in the presence of the inhibitor for 12 h. The right panel shows data normalized to GAPDH levels. *, P < 0.05 for untreated versus glucose; #, P < 0.05 for glucose versus glucose plus LY. Data are representative of three independent experiments. (c) Expression of the dominant negative p85 in control β-cells downregulates the expression of GLUT2. Cells were infected with the indicated adenovirus for 48 h and stimulated with glucose (20 mM) for 12 h. Total RNA was isolated and subjected to semiquantitative RT-PCR for detecting GLUT2. The lower panel shows quantification of the data. Comparisons with controls: *, P < 0.05 for LacZ glucose treated versus LacZ glucose untreated or for p85 glucose untreated versus LacZ glucose untreated; #, P < 0.05 for p85 glucose treated versus LacZ glucose treated. Comparisons with βIRKOs: #, P < 0.05 for p85 glucose untreated or glucose treated versus LacZ glucose untreated versus glucose treated. For comparisons of LacZ controls versus LacZ βIRKOs: *, P < 0.05 for glucose treated or untreated. Representative data from three independent experiments are shown.
FIG. 6.
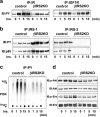
Insulin activates proteins in the insulin/IGF-I signaling pathway in control but not in βIRS2KO β-cells. Cells were stimulated with 100 nM insulin for 0, 1, 5, or 15 min. (a) Tyrosine phosphorylation of insulin receptor and IGF-1 receptor. (b) Tyrosine phosphorylation of IRS-1 and IRS-2. The immunoprecipitates (IP) with anti-IR, anti-IRS-1, or anti-IRS-2 antibodies from the indicated cell lysates with or without insulin stimulation were immunoblotted (IB) with anti-PY (top panels) or the p85 antibody (bottom panels). (c) PI3K activity associated with the phosphotyrosine complex. PI3K activity was measured in the immunoprecipitate with anti-PY from the indicated cell lysates. (d) Phosphorylation of Akt kinase and ERK. The cell lysates were immunoblotted with the indicated antibodies. Representative blots are shown from three independent experiments.
FIG. 7.
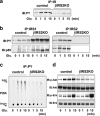
Glucose activates proteins in the insulin/IGF-I signaling pathway in control but not in βIRS2KO β-cells. Cells were treated with glucose (25 mM) for 0, 1, 5, or 15 min. (a) Tyrosine phosphorylation of insulin receptor and IGF-1 receptor. (b) Tyrosine phosphorylation of IRS-1 and IRS-2. The immunoprecipitates (IP) with anti-IR, anti-IRS-1, or anti-IRS-2 from the indicated cell lysates with or without glucose stimulation were immunoblotted (IB) with anti-PY (top panels) or the p85 antibody (bottom panels). (c) PI3K activity associated with the phosphotyrosine complex. PI3K activity was measured in the immunoprecipite with anti-PY from the indicated cell lysates. (d) Phosphorylation of Akt kinase and ERK. The cell lysates were immunoblotted with the indicated antibodies. Representative blots are shown from three independent experiments.
FIG. 8.
Glucose effects on ERK occur independently of insulin signaling. Cells were exposed to glucose (25 mM) (a) or 2-DOG (25 mM) (b) for 0, 1, 5, or 15 min. The cell lysates were immunoblotted (IB) with the indicated antibody. Representative blots from three experiments are shown.
FIG. 9.
Schematic of a link between glucose and insulin signaling in β-cells. (A) Potential direct effects of glucose and/or its metabolites on proteins in the insulin/IGF-1 signaling pathway. (B) Potential indirect effects of glucose and direct effects of insulin following exocytosis of insulin. Akt, v-akt murine thymoma viral oncogene homolog; FoxO-1, forkhead box O1; GRB2, growth factor receptor-bound protein 2; PIP3, phosphatidylinositol (3,4,5)-trisphosphate; mTOR, mammalian target of rapamycin; 4EBP1, translation initiation factor 4e binding protein 1.
Similar articles
- High glucose induces suppression of insulin signalling and apoptosis via upregulation of endogenous IL-1beta and suppressor of cytokine signalling-1 in mouse pancreatic beta cells.
Venieratos PD, Drossopoulou GI, Kapodistria KD, Tsilibary EC, Kitsiou PV. Venieratos PD, et al. Cell Signal. 2010 May;22(5):791-800. doi: 10.1016/j.cellsig.2010.01.003. Epub 2010 Jan 11. Cell Signal. 2010. PMID: 20067833 - Glucose Induces Mouse β-Cell Proliferation via IRS2, MTOR, and Cyclin D2 but Not the Insulin Receptor.
Stamateris RE, Sharma RB, Kong Y, Ebrahimpour P, Panday D, Ranganath P, Zou B, Levitt H, Parambil NA, O'Donnell CP, García-Ocaña A, Alonso LC. Stamateris RE, et al. Diabetes. 2016 Apr;65(4):981-95. doi: 10.2337/db15-0529. Epub 2016 Jan 6. Diabetes. 2016. PMID: 26740601 Free PMC article. - Luseogliflozin increases beta cell proliferation through humoral factors that activate an insulin receptor- and IGF-1 receptor-independent pathway.
Shirakawa J, Tajima K, Okuyama T, Kyohara M, Togashi Y, De Jesus DF, Basile G, Kin T, Shapiro AMJ, Kulkarni RN, Terauchi Y. Shirakawa J, et al. Diabetologia. 2020 Mar;63(3):577-587. doi: 10.1007/s00125-019-05071-w. Epub 2020 Jan 3. Diabetologia. 2020. PMID: 31897526 Free PMC article. - Receptors for insulin and insulin-like growth factor-1 and insulin receptor substrate-1 mediate pathways that regulate islet function.
Kulkarni RN. Kulkarni RN. Biochem Soc Trans. 2002 Apr;30(2):317-22. doi: 10.1042/bst0300317. Biochem Soc Trans. 2002. PMID: 12023872 Review. - Newer perspective on the coupling between glucose-mediated signaling and β-cell functionality.
Shirakawa J, Terauchi Y. Shirakawa J, et al. Endocr J. 2020 Jan 28;67(1):1-8. doi: 10.1507/endocrj.EJ19-0335. Epub 2019 Nov 6. Endocr J. 2020. PMID: 31694991 Review.
Cited by
- Role of phosphatidylinositol-4,5-bisphosphate 3-kinase signaling in vesicular trafficking.
Bhattacharya S, McElhanon KE, Gushchina LV, Weisleder N. Bhattacharya S, et al. Life Sci. 2016 Dec 15;167:39-45. doi: 10.1016/j.lfs.2016.10.018. Epub 2016 Oct 17. Life Sci. 2016. PMID: 27760304 Free PMC article. Review. - CCCTC-binding factor mediates effects of glucose on beta cell survival.
Tsui S, Dai W, Lu L. Tsui S, et al. Cell Prolif. 2014 Feb;47(1):28-37. doi: 10.1111/cpr.12085. Epub 2013 Dec 20. Cell Prolif. 2014. PMID: 24354619 Free PMC article. - Bimodal effect on pancreatic β-cells of secretory products from normal or insulin-resistant human skeletal muscle.
Bouzakri K, Plomgaard P, Berney T, Donath MY, Pedersen BK, Halban PA. Bouzakri K, et al. Diabetes. 2011 Apr;60(4):1111-21. doi: 10.2337/db10-1178. Epub 2011 Mar 4. Diabetes. 2011. PMID: 21378173 Free PMC article. - GLP-1 signalling compensates for impaired insulin signalling in regulating beta cell proliferation in βIRKO mice.
Kawamori D, Shirakawa J, Liew CW, Hu J, Morioka T, Duttaroy A, Burkey B, Kulkarni RN. Kawamori D, et al. Diabetologia. 2017 Aug;60(8):1442-1453. doi: 10.1007/s00125-017-4303-6. Epub 2017 May 20. Diabetologia. 2017. PMID: 28526921 Free PMC article. - Acute insulin signaling in pancreatic beta-cells is mediated by multiple Raf-1 dependent pathways.
Alejandro EU, Kalynyak TB, Taghizadeh F, Gwiazda KS, Rawstron EK, Jacob KJ, Johnson JD. Alejandro EU, et al. Endocrinology. 2010 Feb;151(2):502-12. doi: 10.1210/en.2009-0678. Epub 2010 Jan 7. Endocrinology. 2010. PMID: 20056832 Free PMC article.
References
- Accili, D. 2004. Lilly lecture 2003. The struggle for mastery in insulin action: from triumvirate to republic. Diabetes 531633-1642. - PubMed
- Anonymous. 2003. Whither RNAi? Nat. Cell Biol. 5489-490. - PubMed
- Araki, E., M. A. Lipes, M. E. Patti, J. C. Bruning, B. Haag III, R. S. Johnson, and C. R. Kahn. 1994. Alternative pathway of insulin signalling in mice with targeted disruption of the IRS-1 gene. Nature 372186-190. - PubMed
- Bernal-Mizrachi, E., S. Fatrai, J. D. Johnson, M. Ohsugi, K. Otani, Z. Han, K. S. Polonsky, and M. A. Permutt. 2004. Defective insulin secretion and increased susceptibility to experimental diabetes are induced by reduced Akt activity in pancreatic islet beta cells. J. Clin. Investig. 114928-936. - PMC - PubMed
Publication types
MeSH terms
Substances
Grants and funding
- R01 DK 67536/DK/NIDDK NIH HHS/United States
- R01 DK068721/DK/NIDDK NIH HHS/United States
- P30 DK36836/DK/NIDDK NIH HHS/United States
- P30 DK036836/DK/NIDDK NIH HHS/United States
- R01 DK067536/DK/NIDDK NIH HHS/United States
- R01 DK 68721/DK/NIDDK NIH HHS/United States
LinkOut - more resources
Full Text Sources
Other Literature Sources
Molecular Biology Databases
Miscellaneous
