Autophagy mediates the mitotic senescence transition - PubMed (original) (raw)
. 2009 Apr 1;23(7):798-803.
doi: 10.1101/gad.519709. Epub 2009 Mar 11.
Affiliations
- PMID: 19279323
- PMCID: PMC2666340
- DOI: 10.1101/gad.519709
Autophagy mediates the mitotic senescence transition
Andrew R J Young et al. Genes Dev. 2009.
Abstract
As a stress response, senescence is a dynamic process involving multiple effector mechanisms whose combination determines the phenotypic quality. Here we identify autophagy as a new effector mechanism of senescence. Autophagy is activated during senescence and its activation is correlated with negative feedback in the PI3K-mammalian target of rapamycin (mTOR) pathway. A subset of autophagy-related genes are up-regulated during senescence: Overexpression of one of those genes, ULK3, induces autophagy and senescence. Furthermore, inhibition of autophagy delays the senescence phenotype, including senescence-associated secretion. Our data suggest that autophagy, and its consequent protein turnover, mediate the acquisition of the senescence phenotype.
Figures
Figure 1.
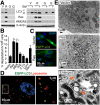
Autophagic activity is up-regulated in OIS. (A) Immunoblot analysis of LC3 in IMR90 cells expressing H-_ras_V12 (R) or vector (V) at 7 d post-antibiotic selection (PS7), uninfected growing cells (G) and quiescent cells (Q) generated by 5 d confluency. (HMGA2) Marker of senescence; (β-actin) loading control; (Bafilomycin A1 [Baf] treatment) 100 mM for 3 h before extraction. (B) Long-lived protein degradation analysis in cells expressing Vector, H-_ras_V12 (Ras), _MEK_Q56P (MEK), or H-_ras_V12 and E1A (R/E) at PS9. Quiescent cells were generated either by 3 d 0.1% serum (0.1%) or 5 d confluency (Conf). Cells cultured in DMEM without amino acids or serum for 4 h (Starve) serve as a positive control. Values are mean ± SEM. (*) P < 0.05 relative to vector. (C) Confocal images of cells expressing EGFP-LC3B and either vector or H-_ras_V12. (D) Confocal images for EGFP-LC3B and LysoTracker in Ras senescent cells. Cells were labeled with 200 mM LysoTracker for 2 h. (E) Electron microscopy images of vector and Ras senescent cells. Arrowheads show representative autophagic vacuoles.
Figure 2.
Correlation between negative feedback on mTOR activity and autophagy induction during stress-induced senescence. (A) ER:Ras-expressing cells were given 100 nM 4-OHT and assessed for SA-β-gal, BrdU incorporation, senescence-associated heterochromatic foci (SAHF) formation, and expression of the indicated proteins at the various time points. Each value of SAHF and BrdU represents the mean ± SEM. For SA-β-gal a representative value is shown. p16 and HMGA2 serve as markers of senescence. (B) Cells were synchronized in G0 using low serum conditions (0.1%), then released by adding 4-OHT together with serum (10%). Cyclin A; cell cycle marker. (C) DNA damage was induced by a 48-h Etoposide (100 μM) treatment. γH2AX, cyclin A, and HMGA2 serve as markers of DNA damage, cell cycle, and senescence, respectively.
Figure 3.
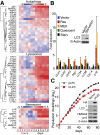
Regulation of autophagy and senescence genes after Ras induction. (A) Transcriptional profiles of autophagy, lysosomal and senescent genes during OIS. Total RNA was extracted from ER:Ras cells at the indicated time points after 4-OHT addition and assayed on Illumina microarrays. The data are the weighted mean of three independent experiments. Log fold changes compared with time 0 are shown. (B) Expression of the indicated genes was assessed by qPCR in cells expressing H-_ras_V12 (Ras), _MEK_Q56P (MEK) or Vector at PS8. (Quiescent) Five days confluent. Amino acid-starved cells (Starv) were generated as in Figure 1B. Cyclin A confirms cell cycle arrest. (p16) Senescence marker. Values are mean ± SEM. (C) Growth curves of IMR90 cells expressing vector or HA-ULK3. Data are representative of three independent experiments. Inset shows immunoblot analysis at day 18.
Figure 4.
Autophagy contributes to the transition to the OIS phenotype. (A) SA-β-gal activity and (B) BrdU incorporation in ER:Ras IMR90 expressing the indicated shRNAs at day 4 after 4-OHT treatment. *P < 0.05 relative to vector. (C) The indicated ER:Ras populations of BJ cells were assessed for colony formation in the presence of 4-OHT. (D,E) Autophagy deficiency delays cytokine production as assessed by immunoblotting (D) and qPCR (E) of ER:Ras IMR90 cells. Values are mean ± SEM of at least three experiments (A,B,E).
Figure 5.
Immunohistochemical analysis of Ki67, Dec1, and LC3 in the same DMBA/TPA-induced mouse papillomas. (A) A representative example is shown from a total of seven papillomas from seven different animals. (Red dotted lines) Basement membrane. (B) Model of the relationship between autophagy and OIS.
Comment in
- Eating to exit: autophagy-enabled senescence revealed.
White E, Lowe SW. White E, et al. Genes Dev. 2009 Apr 1;23(7):784-7. doi: 10.1101/gad.1795309. Genes Dev. 2009. PMID: 19339684
Similar articles
- mTOR inactivation by ROS-JNK-p53 pathway plays an essential role in psedolaric acid B induced autophagy-dependent senescence in murine fibrosarcoma L929 cells.
Qi M, Zhou H, Fan S, Li Z, Yao G, Tashiro S, Onodera S, Xia M, Ikejima T. Qi M, et al. Eur J Pharmacol. 2013 Sep 5;715(1-3):76-88. doi: 10.1016/j.ejphar.2013.05.051. Epub 2013 Jun 26. Eur J Pharmacol. 2013. PMID: 23810968 - Single-cell analysis challenges the connection between autophagy and senescence induced by DNA damage.
Filippi-Chiela EC, Bueno e Silva MM, Thomé MP, Lenz G. Filippi-Chiela EC, et al. Autophagy. 2015;11(7):1099-113. doi: 10.1080/15548627.2015.1009795. Autophagy. 2015. PMID: 25701485 Free PMC article. - Autophagy induction by SIRT6 through attenuation of insulin-like growth factor signaling is involved in the regulation of human bronchial epithelial cell senescence.
Takasaka N, Araya J, Hara H, Ito S, Kobayashi K, Kurita Y, Wakui H, Yoshii Y, Yumino Y, Fujii S, Minagawa S, Tsurushige C, Kojima J, Numata T, Shimizu K, Kawaishi M, Kaneko Y, Kamiya N, Hirano J, Odaka M, Morikawa T, Nishimura SL, Nakayama K, Kuwano K. Takasaka N, et al. J Immunol. 2014 Feb 1;192(3):958-68. doi: 10.4049/jimmunol.1302341. Epub 2013 Dec 23. J Immunol. 2014. PMID: 24367027 - mTOR as a senescence manipulation target: A forked road.
Saoudaoui S, Bernard M, Cardin GB, Malaquin N, Christopoulos A, Rodier F. Saoudaoui S, et al. Adv Cancer Res. 2021;150:335-363. doi: 10.1016/bs.acr.2021.02.002. Epub 2021 Mar 18. Adv Cancer Res. 2021. PMID: 33858600 Review. - Molecular mechanism and regulation of autophagy.
Yang YP, Liang ZQ, Gu ZL, Qin ZH. Yang YP, et al. Acta Pharmacol Sin. 2005 Dec;26(12):1421-34. doi: 10.1111/j.1745-7254.2005.00235.x. Acta Pharmacol Sin. 2005. PMID: 16297339 Review.
Cited by
- Dormancy in solid tumors: implications for prostate cancer.
Ruppender NS, Morrissey C, Lange PH, Vessella RL. Ruppender NS, et al. Cancer Metastasis Rev. 2013 Dec;32(3-4):501-9. doi: 10.1007/s10555-013-9422-z. Cancer Metastasis Rev. 2013. PMID: 23612741 Free PMC article. Review. - The lysosomal proteome of senescent cells contributes to the senescence secretome.
Rovira M, Sereda R, Pladevall-Morera D, Ramponi V, Marin I, Maus M, Madrigal-Matute J, Díaz A, García F, Muñoz J, Cuervo AM, Serrano M. Rovira M, et al. Aging Cell. 2022 Oct;21(10):e13707. doi: 10.1111/acel.13707. Epub 2022 Sep 10. Aging Cell. 2022. PMID: 36087066 Free PMC article. - Mycophenolic Acid overcomes imatinib and nilotinib resistance of chronic myeloid leukemia cells by apoptosis or a senescent-like cell cycle arrest.
Drullion C, Lagarde V, Gioia R, Legembre P, Priault M, Cardinaud B, Lippert E, Mahon FX, Pasquet JM. Drullion C, et al. Leuk Res Treatment. 2012;2012:861301. doi: 10.1155/2012/861301. Epub 2012 Feb 23. Leuk Res Treatment. 2012. PMID: 23213550 Free PMC article. - Implications of endoplasmic reticulum stress and autophagy in aging and cardiovascular diseases.
Ma C, Liu Y, Fu Z. Ma C, et al. Front Pharmacol. 2024 Jul 25;15:1413853. doi: 10.3389/fphar.2024.1413853. eCollection 2024. Front Pharmacol. 2024. PMID: 39119608 Free PMC article. Review. - The cell fate: senescence or quiescence.
Terzi MY, Izmirli M, Gogebakan B. Terzi MY, et al. Mol Biol Rep. 2016 Nov;43(11):1213-1220. doi: 10.1007/s11033-016-4065-0. Epub 2016 Aug 24. Mol Biol Rep. 2016. PMID: 27558094 Review.
References
- Acosta J.C., O'Loghlen A., Banito A., Guijarro M.V., Augert A., Raguz S., Fumagalli M., Da Costa M., Brown C., Popov N., et al. Chemokine signaling via the CXCR2 receptor reinforces senescence. Cell. 2008;133:1006–1018. - PubMed
- Bartkova J., Rezaei N., Liontos M., Karakaidos P., Kletsas D., Issaeva N., Vassiliou L.V., Kolettas E., Niforou K., Zoumpourlis V.C., et al. Oncogene-induced senescence is part of the tumorigenesis barrier imposed by DNA damage checkpoints. Nature. 2006;444:633–637. - PubMed
Publication types
MeSH terms
Substances
LinkOut - more resources
Full Text Sources
Other Literature Sources
Medical
Molecular Biology Databases
Research Materials
Miscellaneous


