Pathway and network-based analysis of genome-wide association studies in multiple sclerosis - PubMed (original) (raw)
. 2009 Jun 1;18(11):2078-90.
doi: 10.1093/hmg/ddp120. Epub 2009 Mar 13.
Nicholas W Galwey, Joanne Wang, Pouya Khankhanian, Raija Lindberg, Daniel Pelletier, Wen Wu, Bernard M J Uitdehaag, Ludwig Kappos; GeneMSA Consortium; Chris H Polman, Paul M Matthews, Stephen L Hauser, Rachel A Gibson, Jorge R Oksenberg, Michael R Barnes
Affiliations
- PMID: 19286671
- PMCID: PMC2678928
- DOI: 10.1093/hmg/ddp120
Pathway and network-based analysis of genome-wide association studies in multiple sclerosis
Sergio E Baranzini et al. Hum Mol Genet. 2009.
Abstract
Genome-wide association studies (GWAS) testing several hundred thousand SNPs have been performed in multiple sclerosis (MS) and other complex diseases. Typically, the number of markers in which the evidence for association exceeds the genome-wide significance threshold is very small, and markers that do not exceed this threshold are generally neglected. Classical statistical analysis of these datasets in MS revealed genes with known immunological functions. However, many of the markers showing modest association may represent false negatives. We hypothesize that certain combinations of genes flagged by these markers can be identified if they belong to a common biological pathway. Here we conduct a pathway-oriented analysis of two GWAS in MS that takes into account all SNPs with nominal evidence of association (P < 0.05). Gene-wise P-values were superimposed on a human protein interaction network and searches were conducted to identify sub-networks containing a higher proportion of genes associated with MS than expected by chance. These sub-networks, and others generated at random as a control, were categorized for membership of biological pathways. GWAS from eight other diseases were analyzed to assess the specificity of the pathways identified. In the MS datasets, we identified sub-networks of genes from several immunological pathways including cell adhesion, communication and signaling. Remarkably, neural pathways, namely axon-guidance and synaptic potentiation, were also over-represented in MS. In addition to the immunological pathways previously identified, we report here for the first time the potential involvement of neural pathways in MS susceptibility.
Figures
Figure 1.
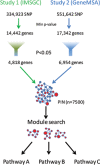
Strategy. A gene-wise _P_-value for association with MS in two independent studies was computed by selecting the _P_-value of the most significant marker within each gene. Genes with a _P_-value less than or equal to 0.05 (red circles) were selected for subsequent analysis. Significant _P_-values were loaded as attributes of the PIN and visualized using Cytoscape. The size of each network node displayed is proportional to its degree of significance. The plugin Jactive modules was used to identify sub-networks of interacting gene products that were also associated with the disease. Each significant module was tested for enrichment in KEGG pathways.
Figure 2.
Module identification. (A) Number of significant modules (size <50 and score >3) identified by Jactive modules in MS and in a panel of other autoimmune (RA, T1D and CD), other neurological (AD and BD), and other unrelated (T2D, HT and CAD) diseases. Each disease is represented by a different color. Filled bars correspond to the results obtained when real _P_-values were used to search for modules. Open bars are the results obtained with randomized _P_-values. (B) Scores of the top 20 modules obtained with real (solid symbols) or randomized (open symbols) _P_-values for each disease. The average and standard deviation of 10 randomizations is shown for each disease.
Figure 3.
Representative modules for MS. Nodes represent proteins and connections represent physical interactions as determined by the curated human PID reported in Rual et al. (44). The size of each node is proportional to the −log (10) _P_-value of association (A, inset). Nodes are colored by chromosome (see key). (A) HLA module. This is the highest scoring module in MS, possibly due to the high significance of HLA-DRA and its interaction with other linked genes in the HLA region. (B) Extended immune module. In addition to HLA genes, this module contains other immune-related genes with more modest _P_-values of association. The significance of the entire module is possibly the result of the many interactions between these genes. (C) MS neural module 1. Seven genes encoding axon guidance molecules (indicated by asterisks) are part of this small module. (D) MS neural module 2. Seven glutamate receptors (gene symbols starting with GR) and two glutamate-related genes (HOMER1 and DLG1) are included in this module (these nine genes indicated by asterisks).
Figure 4.
Representative modules for other diseases. Same conventions as in Figure 3. (A) RA; (B) T1D; (C) CD; (D) T2D; (E) CAD; (F) HT; (G) AD; (H) BD.
Figure 5.
Module specificity. The _P_-values of genes from the representative modules shown in Figures 3 and 4 are displayed as a heatmap. Each row corresponds to a single gene. Genes are organized by their membership of modules. Genes corresponding to the four modules described for MS (Fig. 3) are at the top, followed by genes corresponding to modules from all other diseases. Because modules from different diseases may share one or more genes (e.g. HLA in autoimmune diseases), these may be represented more than once in the figure. Color-coded bars next to each module mark the genes that the module comprises. The same color code in the column headers indicates the disease for which the _P_-values are represented below. In general, genes from modules identified in one disease show the highest _P_-values for that disease, and less significant _P_-values for most other diseases. A notable exception is the HLA genes which show overlap between MS, RA and T1D, all of which are autoimmune diseases. Interestingly, some of the genes from the AD and BD modules show significant _P_-values also in MS.
Figure 6.
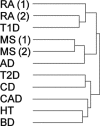
Disease hierarchical tree. The _P_-values of the genes showing the most variable levels of association across diseases were selected to cluster the GWAS studies. Studies connected by the same branch of the dendrogram are more similar to each other than those in different branches. Notably, the two MS studies cluster together, and with those from RA and T1D. Also, the two RA studies cluster together (and with T1D, another autoimmune disease). MS(1), GeneMSA; MS(2), IMSGC; RA(1), Gregersen; RA(2), WTCCC.
Similar articles
- Integrating genome-wide association studies and gene expression data highlights dysregulated multiple sclerosis risk pathways.
Liu G, Zhang F, Jiang Y, Hu Y, Gong Z, Liu S, Chen X, Jiang Q, Hao J. Liu G, et al. Mult Scler. 2017 Feb;23(2):205-212. doi: 10.1177/1352458516649038. Epub 2016 Jul 11. Mult Scler. 2017. PMID: 27207450 - Genome-wide pathway analysis of a genome-wide association study on multiple sclerosis.
Song GG, Choi SJ, Ji JD, Lee YH. Song GG, et al. Mol Biol Rep. 2013 Mar;40(3):2557-64. doi: 10.1007/s11033-012-2341-1. Epub 2012 Dec 14. Mol Biol Rep. 2013. PMID: 23238918 - iPINBPA: an integrative network-based functional module discovery tool for genome-wide association studies.
Wang L, Mousavi P, Baranzini SE. Wang L, et al. Pac Symp Biocomput. 2015:255-66. Pac Symp Biocomput. 2015. PMID: 25592586 - Genome-wide association studies in multiple sclerosis: lessons and future prospects.
Kemppinen A, Sawcer S, Compston A. Kemppinen A, et al. Brief Funct Genomics. 2011 Mar;10(2):61-70. doi: 10.1093/bfgp/elr004. Epub 2011 Feb 10. Brief Funct Genomics. 2011. PMID: 21310812 Review. - A review of genome-wide association studies for multiple sclerosis: classical and hypothesis-driven approaches.
Bashinskaya VV, Kulakova OG, Boyko AN, Favorov AV, Favorova OO. Bashinskaya VV, et al. Hum Genet. 2015 Nov;134(11-12):1143-62. doi: 10.1007/s00439-015-1601-2. Epub 2015 Sep 25. Hum Genet. 2015. PMID: 26407970 Review.
Cited by
- A transcriptome-based association study of growth, wood quality, and oleoresin traits in a slash pine breeding population.
Ding X, Diao S, Luan Q, Wu HX, Zhang Y, Jiang J. Ding X, et al. PLoS Genet. 2022 Feb 2;18(2):e1010017. doi: 10.1371/journal.pgen.1010017. eCollection 2022 Feb. PLoS Genet. 2022. PMID: 35108269 Free PMC article. - Analyzing of Molecular Networks for Human Diseases and Drug Discovery.
Hao T, Wang Q, Zhao L, Wu D, Wang E, Sun J. Hao T, et al. Curr Top Med Chem. 2018;18(12):1007-1014. doi: 10.2174/1568026618666180813143408. Curr Top Med Chem. 2018. PMID: 30101711 Free PMC article. Review. - Homozygosity Haplotype and Whole-Exome Sequencing Analysis to Identify Potentially Functional Rare Variants Involved in Multiple Sclerosis among Sardinian Families.
Fazia T, Marzanati D, Carotenuto AL, Beecham A, Hadjixenofontos A, McCauley JL, Saddi V, Piras M, Bernardinelli L, Gentilini D. Fazia T, et al. Curr Issues Mol Biol. 2021 Oct 27;43(3):1778-1793. doi: 10.3390/cimb43030125. Curr Issues Mol Biol. 2021. PMID: 34889895 Free PMC article. - Protein-protein interaction networks (PPI) and complex diseases.
Safari-Alighiarloo N, Taghizadeh M, Rezaei-Tavirani M, Goliaei B, Peyvandi AA. Safari-Alighiarloo N, et al. Gastroenterol Hepatol Bed Bench. 2014 Winter;7(1):17-31. Gastroenterol Hepatol Bed Bench. 2014. PMID: 25436094 Free PMC article. Review. - From genes to function: the next challenge to understanding multiple sclerosis.
Fugger L, Friese MA, Bell JI. Fugger L, et al. Nat Rev Immunol. 2009 Jun;9(6):408-17. doi: 10.1038/nri2554. Nat Rev Immunol. 2009. PMID: 19444306 Review.
References
- Altshuler D., Hirschhorn J.N., Klannemark M., Lindgren C.M., Vohl M.C., Nemesh J., Lane C.R., Schaffner S.F., Bolk S., Brewer C., et al. The common PPARgamma Pro12Ala polymorphism is associated with decreased risk of type 2 diabetes. Nat. Genet. 2000;26:76–80. - PubMed
- Hauser S.L., Goodin D.S. Multiple sclerosis and other demyelinating diseases. In: Braunwald E., Fauci A.D., Kasper D.L., Hauser S.L., Longo D.L., Jameson J.L., editors. Harrison's Principles in Internal Medicine. 16 edn. New York: McGraw-Hill; 2005. pp. 2461–2471.
- Ebers G.C., Kukay K., Bulman D.E., Sadovnick A.D., Rice G., Anderson C., Armstrong H., Cousin K., Bell R.B., Hader W., et al. A full genome search in multiple sclerosis. Nat. Genet. 1996;13:472–476. - PubMed
MeSH terms
LinkOut - more resources
Full Text Sources
Other Literature Sources
Medical
Molecular Biology Databases


