Signals of recent positive selection in a worldwide sample of human populations - PubMed (original) (raw)
Signals of recent positive selection in a worldwide sample of human populations
Joseph K Pickrell et al. Genome Res. 2009 May.
Abstract
Genome-wide scans for recent positive selection in humans have yielded insight into the mechanisms underlying the extensive phenotypic diversity in our species, but have focused on a limited number of populations. Here, we present an analysis of recent selection in a global sample of 53 populations, using genotype data from the Human Genome Diversity-CEPH Panel. We refine the geographic distributions of known selective sweeps, and find extensive overlap between these distributions for populations in the same continental region but limited overlap between populations outside these groupings. We present several examples of previously unrecognized candidate targets of selection, including signals at a number of genes in the NRG-ERBB4 developmental pathway in non-African populations. Analysis of recently identified genes involved in complex diseases suggests that there has been selection on loci involved in susceptibility to type II diabetes. Finally, we search for local adaptation between geographically close populations, and highlight several examples.
Figures
Figure 1.
Top 10 iHS (A) and XP-EHH (B) signals by population cluster. Each row is a 200-kb genomic window, each column is a geographic region, and each cell is colored according to the position of the window in the empirical distribution of scores for that region. Plotted are the most extreme 10 windows for each geographic region. Gray cells in A are windows that have fewer than 20 SNPs for which iHS was calculated (see Methods). To the right of each row is a list of genes that fall in the window. Windows where the genes are in red are discussed in the text. Note that interpretation of the overlap in XP-EHH signals is complicated by the need for a reference population; see the main text.
Figure 2.
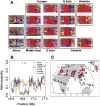
Evidence for selection in a region containing part of the gene C21orf34. (A) Haplotype plots in a 500-kb region on chromosome 21 surrounding the locus. Each row represents a haplotype, and each column a SNP. Rows are colored the same if and only if the underlying sequence is identical (some low-frequency SNPs are excluded). For full details on the generation of these plots, see Conrad et al. (2006). (B) Heterozygosity in the same region. Lines show heterozygosity calculated in a sliding window of three SNPs across the region in different populations. Black arrows at the top of the plot represent the positions of SNPs with _F_ST > 0.6 (i.e., in the 0.01% tail of worldwide _F_ST). (C). A pie chart of the worldwide distribution of a SNP that tags the red haplotype in A (rs2823850). (Red) The derived allele frequency; (blue) the ancestral allele frequency.
Figure 3.
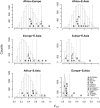
_F_ST around loci involved in natural variation in pigmentation. For each SNP found to be associated with pigmentation in a genome-wide scan, we plot the maximum pairwise _F_ST between geographic regions in a 100-kb window surrounding the SNP in the HGDP data, as well as a histogram of the null distribution calculated by finding the maximum _F_ST in 100-kb windows surrounding each of 10,000 random SNPs. The dotted lines shows the position beyond which 5% of the random SNPs fall, and the solid lines the position beyond which 1% of the random SNPs fall. Gene names that are starred fall in the 5% tail of at least one comparison, and those with two stars fall in the 1% tail of at least one comparison. Letters are positioned along the _y_-axis to improve readability. The key in the bottom right panel applies to all panels.
Figure 4.
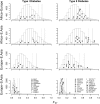
_F_ST around loci involved in natural variation in diabetes susceptibility. For each SNP associated with either type I or type II diabetes we plot the maximum pairwise _F_ST between geographic regions in a 100-kb window surrounding the SNP in the HGDP data, as well as a histogram of the null distribution calculated by finding the maximum _F_ST in 100-kb windows surrounding each of 10,000 random SNPs. The dotted lines shows the position beyond which 5% of the random SNPs fall, and the solid lines the position beyond which 1% of the random SNPs fall. Gene names that are starred fall in the 5% tail of at least one comparison, and those with two stars fall in the 1% tail of at least one comparison. Letters are positioned along the _y_-axis to improve readability. The key in the bottom panel of each column applies to the entire column.
Figure 5.
Selection signals in the NRG–ERBB4 pathway. (A) A schematic of the NRG–ERBB4 pathway, drawn from interactions reported in KEGG (Kanehisa et al. 2008) and Mei and Xiong (2008). Each oval represents a gene, and the colored circles denote the geographic regions that have significant selection signals (empirical scores in the top 5% of the distribution). We excluded Oceania and the Americas from this plot since selection scans are expected to have low power in these regions. For ADAM17, the selection statistic is XP-EHH; for the others it is iHS. (B) Haplotype plots at the putative selected region in ERBB4. (C) Worldwide allele frequencies of a SNP that tags the red haplotype in B (rs1505353). (Red) The derived allele; (blue) the ancestral allele.
Figure 6.
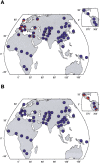
Worldwide allele frequencies of two nonsynonymous SNPs showing evidence of local adaptation. (A) Frequencies of rs5743810 in TLR6; (B) frequencies of rs12421620 in DPP3. (Red) The frequency of the derived allele; (blue) the frequency of the ancestral allele.
Similar articles
- Genetic variation and recent positive selection in worldwide human populations: evidence from nearly 1 million SNPs.
López Herráez D, Bauchet M, Tang K, Theunert C, Pugach I, Li J, Nandineni MR, Gross A, Scholz M, Stoneking M. López Herráez D, et al. PLoS One. 2009 Nov 18;4(11):e7888. doi: 10.1371/journal.pone.0007888. PLoS One. 2009. PMID: 19924308 Free PMC article. - Targeted resequencing of two genes, RAGE and POLL, confirms findings from a genome-wide scan for adaptive evolution and provides evidence for positive selection in additional populations.
Kelley JL, Turkheimer K, Haney M, Swanson WJ. Kelley JL, et al. Hum Mol Genet. 2009 Feb 15;18(4):779-84. doi: 10.1093/hmg/ddn399. Epub 2008 Dec 5. Hum Mol Genet. 2009. PMID: 19060005 Free PMC article. - A new approach for using genome scans to detect recent positive selection in the human genome.
Tang K, Thornton KR, Stoneking M. Tang K, et al. PLoS Biol. 2007 Jul;5(7):e171. doi: 10.1371/journal.pbio.0050171. Epub 2007 Jun 19. PLoS Biol. 2007. PMID: 17579516 Free PMC article. - Identifying adaptive alleles in the human genome: from selection mapping to functional validation.
Werren EA, Garcia O, Bigham AW. Werren EA, et al. Hum Genet. 2021 Feb;140(2):241-276. doi: 10.1007/s00439-020-02206-7. Epub 2020 Jul 29. Hum Genet. 2021. PMID: 32728809 Review. - Signatures of positive selection: from selective sweeps at individual loci to subtle allele frequency changes in polygenic adaptation.
Stephan W. Stephan W. Mol Ecol. 2016 Jan;25(1):79-88. doi: 10.1111/mec.13288. Epub 2015 Jul 27. Mol Ecol. 2016. PMID: 26108992 Review.
Cited by
- MeHA: A Computational Framework in Revealing the Genetic Basis of Animal Mental Health Traits Under an Intensive Farming System-A Case Study in Pigs.
Jiang J, Xu L, Zhuang Y, Wei X, Zhang Z, Zhao W, Wang Q, Ye X, Gu J, Cao C, Sun J, He K, Zhang Z, Wang Q, Pan Y, Wang Z. Jiang J, et al. Biology (Basel). 2024 Oct 21;13(10):843. doi: 10.3390/biology13100843. Biology (Basel). 2024. PMID: 39452151 Free PMC article. - Sirenian genomes illuminate the evolution of fully aquatic species within the mammalian superorder afrotheria.
Tian R, Zhang Y, Kang H, Zhang F, Jin Z, Wang J, Zhang P, Zhou X, Lanyon JM, Sneath HL, Woolford L, Fan G, Li S, Seim I. Tian R, et al. Nat Commun. 2024 Jul 2;15(1):5568. doi: 10.1038/s41467-024-49769-x. Nat Commun. 2024. PMID: 38956050 Free PMC article. - Mapping and annotating genomic loci to prioritize genes and implicate distinct polygenic adaptations for skin color.
Kim B, Kim DS, Shin JG, Leem S, Cho M, Kim H, Gu KN, Seo JY, You SW, Martin AR, Park SG, Kim Y, Jeong C, Kang NG, Won HH. Kim B, et al. Nat Commun. 2024 Jun 7;15(1):4874. doi: 10.1038/s41467-024-49031-4. Nat Commun. 2024. PMID: 38849341 Free PMC article. - Genomic and Phenotypic Adaptations of Rattus tanezumi to Cold Limit Its Further Northward Expansion and Range Overlap with R. norvegicus.
Zhang MY, Cao RD, Chen Y, Ma JC, Shi CM, Zhang YF, Zhang JX, Zhang YH. Zhang MY, et al. Mol Biol Evol. 2024 Jun 1;41(6):msae106. doi: 10.1093/molbev/msae106. Mol Biol Evol. 2024. PMID: 38829799 Free PMC article. - Approximate Bayesian computational methods to estimate the strength of divergent selection in population genomics models.
Lukaszewicz M, Salia OI, Hohenlohe PA, Buzbas EO. Lukaszewicz M, et al. J Comput Math Data Sci. 2024 Mar;10:100091. doi: 10.1016/j.jcmds.2024.100091. Epub 2024 Feb 7. J Comput Math Data Sci. 2024. PMID: 38616846 Free PMC article.
References
- Barreiro L.B., Laval G., Quach H., Patin E., Quintana-Murci L. Natural selection has driven population differentiation in modern humans. Nat. Genet. 2008;40:340–345. - PubMed
- Bowcock A., Sartorelli V. Polymorphism and mapping of the IGF1 gene, and absence of association with stature among African Pygmies. Hum. Genet. 1990;85:349–354. - PubMed
- Campbell C.D., Ogburn E.L., Lunetta K.L., Lyon H.N., Freedman M.L., Groop L.C., Altshuler D., Ardlie K.G., Hirschhorn J.N. Demonstrating stratification in a European American population. Nat. Genet. 2005;37:868–872. - PubMed
Publication types
MeSH terms
Substances
LinkOut - more resources
Full Text Sources
Other Literature Sources


