Macrophages promote axon regeneration with concurrent neurotoxicity - PubMed (original) (raw)
Macrophages promote axon regeneration with concurrent neurotoxicity
John C Gensel et al. J Neurosci. 2009.
Abstract
Activated macrophages can promote regeneration of CNS axons. However, macrophages also release factors that kill neurons. These opposing functions are likely induced simultaneously but are rarely considered together in the same experimental preparation. A goal of this study was to unequivocally document the concurrent neurotoxic and neuroregenerative potential of activated macrophages. To do so, we quantified the length and magnitude of axon growth from enhanced green fluorescent protein-expressing dorsal root ganglion (DRG) neurons transplanted into the spinal cord in relationship to discrete foci of activated macrophages. Macrophages were activated via intraspinal injections of zymosan, a potent inflammatory stimulus known to increase axon growth and cause neurotoxicity. Using this approach, a significant increase in axon growth up to macrophage foci was evident. Within and adjacent to macrophages, DRG and spinal cord axons were destroyed. Macrophage toxicity became more evident when zymosan was injected closer to DRG soma. Under these conditions, DRG neurons were killed or their ability to extend axons was dramatically impaired. The concurrent induction of pro-regenerative and neurotoxic functions in zymosan-activated macrophages (ZAMs) was confirmed in vitro using DRG and cortical neurons. Importantly, the ability of ZAMs to stimulate axon growth was transient; prolonged exposure to factors produced by ZAMs enhanced cell death and impaired axon growth in surviving neurons. Lipopolysaccharide, another potent macrophage activator, elicited a florid macrophage response, but without enhancing axon growth or notable toxicity. Together, these data show that a single mode of activation endows macrophages with the ability to simultaneously promote axon regeneration and cell killing.
Figures
Figure 1.
An in vivo model for assessing growth/regeneration of a defined axon population. Adult mouse EGFP+ DRG neurons were transplanted into the adult rat cervical (C1/2) spinal cord using the technique described by Davies et al. (1999). Eight days after transplantation, DRG axons extend into the spinal cord rostral and caudal from the injection site. A, A confocal montage of a sagittal section of the spinal cord 8 d after transplantation. B–D, High-power montage of boxed areas in A showing the relationship between GFP+ axons (green) and GFAP+ astrocytes (red) throughout the rostral (B) and caudal (D) axes of the intact spinal cord. Scale bars: A, 875 μm; B–D, 200 μm.
Figure 2.
ZAMs promote axon growth in the spinal cord. A, B, Confocal montages of GFP+ DRG axons growing toward a site of zymosan (A) or control (B) injection ∼4 mm caudal to the site of DRG transplantation. These images are representative of the average caudal axon growth from each group. Note the significant increase in axon growth toward foci of ZAMs (dotted circle) in A. C, Quantification of axonal outgrowth from the graft reveals a significant increase in axon growth in spinal cords injected with zymosan. *p < 0.05 versus controls over the distance measured.
Figure 3.
Zymosan-activated macrophages modify the surrounding microenvironment creating passages for axon growth. A, B, A three-dimensional (3D) schematic showing the formation of a graded column of activated microglia and macrophages emanating from a zymosan injection site (A, B, D, green). Phagocytic monocyte-derived macrophages (MDMs) occupy the center of the injection site (see also Fig. 8) (Popovich et al., 2002). Activated microglia (blue) lie adjacent to MDMs and form a column of activated cells that extends for several millimeters. C, D, A two-dimensional representation of spinal cord sections stained for microglia/macrophages (OX42 antibody), then rendered in third dimension in A and B. Green shading corresponds with the center of the injection site and the area where MDMs infiltrate. These areas were manually outlined for 3D rendering. Blue shading corresponds with automated threshold scans of OX42+ microglia in white matter. GM, Gray matter. E, F, Graded levels of myelin loss (MBP; red) surround the zymosan injection site. EGFP+ DRG axons (green) grow through regions of intact and degenerating myelin into areas occupied by activated microglia. Axon growth is diminished or aborted immediately adjacent to sites of MDM accumulation (dotted line in F). Scale bar: A, B, 34 μm; C, D, 186 μm; E, F, 200 μm.
Figure 4.
ZAMs induce a gradient of CNTF expression. A–C, Parasaggital section of spinal cord transplanted with DRG neurons and injected with zymosan ∼4 mm caudal to the transplant. Individual confocal scans show EGFP+ axons (A, green) and CNTF immunoreactivity (B, red). Merged images show nuclear labeling (DRAQ5; C, blue). Note that DRG axons grow toward ZAMs through a dense CNTF+ astroglial substrate then stop abruptly at ZAM interface. A linear scan of staining intensity between the DRG transplant site and the core of ZAMs shows an increase in CNTF immunoreactivity closer to the zymosan injection site; CNTF labeling is noticeably absent from the ZAM core. D–F, High-powered confocal images show that GFAP+ astrocytes (D, green) are the predominant source of CNTF (E, red). Merged images show nuclear labeling (DRAQ5; F, blue). Scale bar: A–C, 200 μm; D–F, 7.5 μm.
Figure 5.
Abortive axon growth occurs at the border of ZAMs. A, B, EGFP+ axons (green) stop growing or turn as they approach or enter ZAM foci (OX42; red). Note the phagocytic inclusions of GFP remnants (appear yellow) in ZAM (see also Fig. 6). B is a higher-power image of the box in A. C–E, Abortive axon growth at the ZAM interface colocalizes with dense accumulation of CSPGs (WFA; D, E, red). All nuclei are stained with DRAQ5 (blue). Scale bar: A, 875 μm; B, 350 μm; C–E, 100 μm.
Figure 6.
Fragments of growing or degenerating DRG axons are engulfed as they enter areas containing ZAMs. A, EGFP+ axons grow toward ZAM foci, then turn (see also Fig. 5) or become fragmented (die back). EGFP+ inclusions are evident within macrophages (arrow). B–D, High-power _Z_-stack of EGFP+ DRG axon fragments (green) engulfed by OX42+ macrophages (red). Scale bar: A, 125 μm; B–D, 12 μm.
Figure 7.
Macrophage activation close to neuron cell bodies impairs axon growth. A, B, Representative images of average axon growth after injecting zymosan 4 mm (A) or 2 mm (B) caudal to the DRG transplant (green, EGFP DRGs; red, OX42). In the 2 mm group, axon growth is impaired (B, D), and inflammation is enhanced in and around the graft compared with the 4 mm group (A.) C, In ∼29% (5 of 17) of cases, DRG grafts were not viable at 8 d if macrophages were activated within 2 mm of the graft. In contrast, when macrophages were activated 4 mm from transplants, all transplants were viable at 8 d and extended processes over several millimeters. D, When DRGs survived in the 2 mm group, the overall density of axonal outgrowth was significantly reduced (*p < 0.05, compared with the 4 mm group) as was the average length of the longest axon (2 mm zymosan, 2.9 ± 0.4 mm vs 4 mm zymosan, 4.8 ± 0.4 mm; p < 0.05). Note that A is also pictured in Figure 2, but without OX42 labeling. Scale bar: A, B, 146 μm; C, 100 μm.
Figure 8.
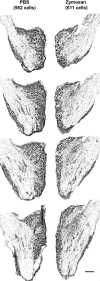
ZAMs are neurotoxic in DRGs. Serial sections cut through cresyl violet-stained DRGs injected with PBS (control) or zymosan (3 d after injection) reveal marked cell loss and gliosis in zymosan-injected ganglia. In this specimen, DRG neurons were decreased ∼33% by zymosan versus neurons in PBS-injected DRGs. Scale bar, 200 μm.
Figure 9.
Intraspinal zymosan causes pathology in part via recruitment of blood monocytes. A, Zymosan microinjection potently activates CNS macrophages (OX42+ cells) at the site of injection within 7 d. B, The zymosan-mediated macrophage response is significantly reduced in macrophage-depleted subjects. C, D, Adjacent sections stained with neurofilament (NF) antibody show that ZAMs cause axonal pathology (C), which is significantly reduced after macrophage depletion (D). Images are from subjects representing the statistical mean for the control (A, C) and macrophage-depleted (B, D) groups. E, Quantitative analysis of images in A—D confirm that macrophage depletion reduces intraspinal accumulation of macrophages ∼50% with a concomitant decrease in axon pathology (*p < 0.05, vs controls). Scale bar: A–D, 100 μm.
Figure 10.
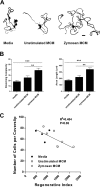
ZAMs simultaneously promote axon growth and killing of DRG neurons in vitro. A, β-Tubulin III-stained cellular profiles representative of the average branching complexity and axon length of neurons from cultures treated for 24 h with media, unstimulated MCM, or zymosan-stimulated MCM. Scale bar, 40 μm. B, A semiautomated quantification scheme, based on the technique of Sholl (1953) (see also Materials and Methods), was used to quantify the effects of different MCMs on axonal sprouting and axon length. In each case, zymosan MCM significantly increased these indices of growth/regeneration (***p < 0.001, zymosan vs media; **p < 0.01, zymosan vs unstimulated MCM). C, An inverse relationship exists between the overall axon regenerative index (composite of axon branching and length) and neuron survival. Note that zymosan MCM stimulates extensive axon growth while promoting neuronal killing. Cell killing was inferred based on fewer cells per coverslip despite plating equal numbers of DRGs in each well.
Figure 11.
Prolonged exposure of neurons to zymosan MCM results in toxicity and axonal degeneration. A, Examples of β-tubulin III+ DRG neurons exposed for 48 h to unstimulated or zymosan MCM. After 48 h, neurons exposed to zymosan MCM become dystrophic and begin to degenerate. Scale bar, 180 μm. B, A comparison of DRG neuron survival at 24 and 48 h after stimulation with control media or different types of MCM. Only zymosan MCM kills neurons after 48 h of stimulation (*p < 0.05, vs 24 h zymosan MCM). C, Quantification of neurons with intact axons in each group show that prolonged stimulation with zymosan MCM reduces the overall complexity and length of DRG axons (**p < 0.01, compared with control media; *p < 0.05, compared with unstimulated MCM). Interestingly, 48 h MCM from LPS-stimulated macrophages also reduces axonal branching (p < 0.05, vs unstimulated MCM) but not length.
Figure 12.
ZAMs kill cortical neurons. A, B, Examples of cortical neurons exposed to unstimulated MCM (A) or zymosan MCM (B) for 24 h. Scale bar, 100 μm. C, Zymosan MCM kills ∼70% of primary cortical neurons within 24 h of stimulation (***p < 0.001, vs media and unstimulated MCM). LPS MCM was also neurotoxic, but to a lesser extent than zymosan MCM (*p < 0.05, vs media but not unstimulated MCM). Glutamate-mediated killing served as a positive control (&&&p < 0.001, vs media, unstimulated MCM, and LPS MCM). NS, Not significant.
Figure 13.
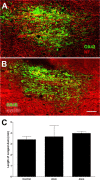
The ability of macrophages to promote axon growth is specific to the activating ligand. A, B, Cervical spinal cord sections stained 8 d after intraspinal LPS injection. In contrast to the effects of ZAMs (see Figs. 3–6), intraspinal LPS activates macrophages (OX42; green) without causing profound axon [neurofilament (NF); red; A)] or myelin (fluoromyelin; B) pathology. A, Intact axons can be seen coursing through the activated macrophages. B, Some myelin pallor is evident, but this does not extend beyond the injection site. Scale bar, 100 μm. C, Unlike zymosan, LPS has no effect on the growth of transplanted DRG neurons. LPS was injected 2 mm (p = 0.743) or 4 mm (p = 0.317) caudal to the DRG transplant.
Similar articles
- miR-155 Deletion in Mice Overcomes Neuron-Intrinsic and Neuron-Extrinsic Barriers to Spinal Cord Repair.
Gaudet AD, Mandrekar-Colucci S, Hall JC, Sweet DR, Schmitt PJ, Xu X, Guan Z, Mo X, Guerau-de-Arellano M, Popovich PG. Gaudet AD, et al. J Neurosci. 2016 Aug 10;36(32):8516-32. doi: 10.1523/JNEUROSCI.0735-16.2016. J Neurosci. 2016. PMID: 27511021 Free PMC article. - Genetic study of axon regeneration with cultured adult dorsal root ganglion neurons.
Saijilafu, Zhou FQ. Saijilafu, et al. J Vis Exp. 2012 Aug 17;(66):4141. doi: 10.3791/4141. J Vis Exp. 2012. PMID: 23117482 Free PMC article. - Toll-Like Receptors and Dectin-1, a C-Type Lectin Receptor, Trigger Divergent Functions in CNS Macrophages.
Gensel JC, Wang Y, Guan Z, Beckwith KA, Braun KJ, Wei P, McTigue DM, Popovich PG. Gensel JC, et al. J Neurosci. 2015 Jul 8;35(27):9966-76. doi: 10.1523/JNEUROSCI.0337-15.2015. J Neurosci. 2015. PMID: 26156997 Free PMC article. - The intriguing nature of dorsal root ganglion neurons: Linking structure with polarity and function.
Nascimento AI, Mar FM, Sousa MM. Nascimento AI, et al. Prog Neurobiol. 2018 Sep;168:86-103. doi: 10.1016/j.pneurobio.2018.05.002. Epub 2018 May 2. Prog Neurobiol. 2018. PMID: 29729299 Review. - Netrin-1 signaling for sensory axons: Involvement in sensory axonal development and regeneration.
Masuda T, Yaginuma H, Sakuma C, Ono K. Masuda T, et al. Cell Adh Migr. 2009 Apr-Jun;3(2):171-3. doi: 10.4161/cam.3.2.7837. Epub 2009 Apr 14. Cell Adh Migr. 2009. PMID: 19262170 Free PMC article. Review.
Cited by
- Microglia coordinate cellular interactions during spinal cord repair in mice.
Brennan FH, Li Y, Wang C, Ma A, Guo Q, Li Y, Pukos N, Campbell WA, Witcher KG, Guan Z, Kigerl KA, Hall JCE, Godbout JP, Fischer AJ, McTigue DM, He Z, Ma Q, Popovich PG. Brennan FH, et al. Nat Commun. 2022 Jul 14;13(1):4096. doi: 10.1038/s41467-022-31797-0. Nat Commun. 2022. PMID: 35835751 Free PMC article. - Administration of chondroitinase ABC rostral or caudal to a spinal cord injury site promotes anatomical but not functional plasticity.
Tom VJ, Kadakia R, Santi L, Houlé JD. Tom VJ, et al. J Neurotrauma. 2009 Dec;26(12):2323-33. doi: 10.1089/neu.2009.1047. J Neurotrauma. 2009. PMID: 19659409 Free PMC article. - A New Paradigm in Spinal Cord Injury Therapy: from Cell-free Treatment to Engineering Modifications.
Qin B, Hu XM, Huang YX, Yang RH, Xiong K. Qin B, et al. CNS Neurol Disord Drug Targets. 2024;23(5):656-673. doi: 10.2174/1871527322666230418090857. CNS Neurol Disord Drug Targets. 2024. PMID: 37076458 Review. - Macrophage-Engineered Vesicles for Therapeutic Delivery and Bidirectional Reprogramming of Immune Cell Polarization.
Neupane KR, McCorkle JR, Kopper TJ, Lakes JE, Aryal SP, Abdullah M, Snell AA, Gensel JC, Kolesar J, Richards CI. Neupane KR, et al. ACS Omega. 2021 Jan 26;6(5):3847-3857. doi: 10.1021/acsomega.0c05632. eCollection 2021 Feb 9. ACS Omega. 2021. PMID: 33585763 Free PMC article.
References
- Basu S, Binder RJ, Suto R, Anderson KM, Srivastava PK. Necrotic but not apoptotic cell death releases heat shock proteins, which deliver a partial maturation signal to dendritic cells and activate the NF-kappa B pathway. Int Immunol. 2000;12:1539–1546. - PubMed
- Batchelor PE, Liberatore GT, Wong JYF, Porritt MJ, Frerichs F, Donnan GA, Howells DW. Activated macrophages and microglia induce dopaminergic sprouting in the injured striatum sand express brain-derived neurotrophic factor and glial cell line-derived neurotrophic factor. J Neurosci. 1999;19:1708–1716. - PMC - PubMed
- Batchelor PE, Porritt MJ, Martinello P, Parish CL, Liberatore GT, Donnan GA, Howells DW. Macrophages and microglia produce local trophic gradients that stimulate axonal sprouting toward but not beyond the wound edge. Mol Cell Neurosci. 2002;21:436–453. - PubMed
- Benowitz LI, Yin YQ. Combinatorial treatments for promoting axon regeneration in the CNS: strategies for overcoming inhibitory signals and activating neurons' intrinsic growth state. Dev Neurobiol. 2007;67:1148–1165. - PubMed
Publication types
MeSH terms
Substances
LinkOut - more resources
Full Text Sources


