Conformational switching within individual amyloid fibrils - PubMed (original) (raw)
Conformational switching within individual amyloid fibrils
Natallia Makarava et al. J Biol Chem. 2009.
Abstract
A key structural component of amyloid fibrils is a highly ordered, crystalline-like cross-beta-sheet core. Conformationally different amyloid structures can be formed within the same amino acid sequence. It is generally assumed that individual fibrils consist of conformationally uniform cross-beta-structures. Using mammalian recombinant prion protein (PrP), we showed that, contrary to common perception, amyloid is capable of accommodating a significant conformational switching within individual fibrils. The conformational switch occurred when the amino acid sequence of a PrP variant used as a precursor substrate in a fibrillation reaction was not compatible with the strain-specific conformation of the fibrillar template. Despite the mismatch in amino acid sequences between the substrate and template, individual fibrils recruited the heterologous PrP variant; however, the fibril elongation proceeded through a conformational adaptation, resulting in a change in amyloid strain within individual fibrils. This study illustrates the high adaptation potential of amyloid structures and suggests that conformational switching within individual fibrils may account for adaptation of amyloid strains to a heterologous substrate. This work proposes a new mechanistic explanation for the phenomenon of strain conversion and illustrates the direction in evolution of amyloid structures. This study also provides a direct illustration that catalytic activity of self-replicating amyloid structures is not ultimately coupled with their templating effect.
Figures
FIGURE 1.
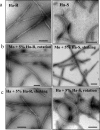
Electron microscopy images of R- and S-fibrils. a, hamster R-fibrils (Ha-R; left panel) and S-fibrils (Ha-S;right panel). b, mouse (Mo) fibrils formed in reactions seeded with 5% hamster R-fibrils under rotation (left panel) and with 5% hamster S-fibrils under shaking (right panel). c, hamster (Ha) fibrils formed in reactions seeded with 5% hamster R-fibrils under shaking (left panel) and with 5% hamster S-fibrils under rotation (right panel). Scale bars, 0.1 μm.
FIGURE 2.
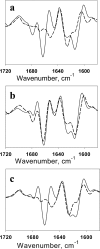
Second derivatives of the FTIR spectra. a, spectra of hamster R-fibrils (solid line) and S-fibrils (dashed line).b, spectrum of daughter mouse fibrils formed in reactions seeded with 5% hamster R-fibrils under rotation (solid line) and the spectrum of parent hamster R-fibrils (dashed line). c, spectrum of daughter mouse fibrils formed in reactions seeded with 5% hamster S-fibrils under shaking (solid line) and the spectrum of parent hamster S-fibrils (dashed line).
FIGURE 3.
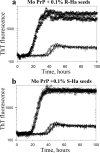
Kinetics of cross-seeded fibrillation. a, the kinetics of fibrillation of mouse (Mo) PrP (2 μ
m
) seeded with 0.1% (w/w) of hamster R-fibrils (Ha-R; triangles) and non-seeded controls (solid lines). b, the kinetics of fibrillation of mouse PrP (2 μ
m
) seeded with 0.1% (w/w) of hamster S-fibrils (circles) and non-seeded controls (solid lines). The kinetic curves are shown in duplicates. The kinetics was monitored in 96-well plate as described under “Experimental Procedures.” The remaining lag phase observed in these seeded reactions should not be attributed to the species specificity of seeding between hamster seeds and mouse PrP. Similar lag phases were also observed in homologous seeding assays (9, 14).
FIGURE 4.
Analysis of fibril composition. Microscopy images of fibrils produced in non-seeded reactions from mouse (Mo) PrP (a), hamster (Ha) PrP (b), or from mouse PrP in reactions seeded with 30% hamster S-fibrils (two panels in c). Fibrils were double-stained with Fab D13 (green) and Ab 3F4 (red). The microscopy images were transformed into two-dimensional fluorescence intensity scattering plots (insets) (13). Red fluorescence intensities are plotted on the horizontal axis, and the_green_ intensities are plotted on the vertical axis. Scale bars, 5 μm. d, the fluorescence intensity profile of hamster S-seeded mouse fibril. The fluorescence profiles was measured along individual fibrils and recorded in both red and green channels.
FIGURE 5.
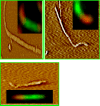
Atomic force fluorescence microscopy imaging of hamster-mouse fibrils. Fibrils were formed from mouse PrP in the reactions seeded with 30% hamster S-fibrils and stained with Ab 3F4 (red) and Fab D13 (green). Approximately 100 individual hybrid fibrils were examined by AFFM; no signs of the lateral association between preformed individual hamster and mouse fibrils were found. Representative AFFM images shows that individual fibrils consisted of two sections: the sections made of hamster PrP had a curvy S-like shape and displayed red fluorescence, whereas the sections made of mouse PrP had a straight R-like shape and showed_green_ fluorescence. Because fibrils were decorated by primary and secondary antibody, fibril dimensions and morphological details cannot be revealed from AFFM imaging.
FIGURE 6.
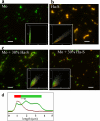
Analysis of fibril conformation. Immunofluorescence microscopy imaging of hamster S-fibrils (Ha-S; a), hamster R-fibrils (Ha-R; b, left), mouse R-fibrils (Mo; b, right), and fibrils produced from mouse PrP in reactions seeded with 30% hamster S-fibrils (c). Two enlarged images of fibrils are included in_c_. Fibrils were double-stained with Fab R2 (green) and Ab AG4 (red). The exposed conformation of epitope 225–230 is evident by green or yellow colors (a and_c_). The color variation from green to yellow in_a_ and c arises as a result of stochastic variation in the ratio of R2 and AG4 bound within individual S-fibrils and across the fibrillar population and should not be viewed as an indication of structural polymorphism or heterogeneity within the S-population. The microscopy images were transformed into two-dimensional fluorescence intensity scattering plots (insets) as described previously (13). Red fluorescence intensities are plotted on the horizontal axis, and the_green_ intensities are plotted on the vertical axis. Some structures showed an apparent switch back and forth between S- and R-conformations that was due to artifacts related to co-aggregation or overlap between several individual fibrils. Scale bars, 5 μm. d, electron microscopy images of fibrils produced from mouse PrP in the reactions seeded with 30% hamster S-fibrils. Arrows point to the transition region between S- and R-structures. Scale bars, 0.2 μm.
FIGURE 7.
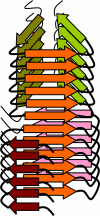
A schematic diagram illustrating conformational switch within individual fibrils. The hybrid fibril consists of two segments with different global folds, both of which share β-strands (orange) with similar conformation that form parallel β-sheets. This diagram does not intend to model PrP structure within amyloid fibrils.
Similar articles
- Switching in amyloid structure within individual fibrils: implication for strain adaptation, species barrier and strain classification.
Baskakov IV. Baskakov IV. FEBS Lett. 2009 Aug 20;583(16):2618-22. doi: 10.1016/j.febslet.2009.05.044. Epub 2009 May 29. FEBS Lett. 2009. PMID: 19482025 Free PMC article. Review. - Highly promiscuous nature of prion polymerization.
Makarava N, Lee CI, Ostapchenko VG, Baskakov IV. Makarava N, et al. J Biol Chem. 2007 Dec 14;282(50):36704-13. doi: 10.1074/jbc.M704926200. Epub 2007 Oct 16. J Biol Chem. 2007. PMID: 17940285 - Conformational stability of PrP amyloid fibrils controls their smallest possible fragment size.
Sun Y, Makarava N, Lee CI, Laksanalamai P, Robb FT, Baskakov IV. Sun Y, et al. J Mol Biol. 2008 Feb 29;376(4):1155-67. doi: 10.1016/j.jmb.2007.12.053. Epub 2008 Jan 3. J Mol Biol. 2008. PMID: 18206163 Free PMC article. - Fibril conformation as the basis of species- and strain-dependent seeding specificity of mammalian prion amyloids.
Jones EM, Surewicz WK. Jones EM, et al. Cell. 2005 Apr 8;121(1):63-72. doi: 10.1016/j.cell.2005.01.034. Cell. 2005. PMID: 15820679 - Amyloid-a state in many guises: survival of the fittest fibril fold.
Pedersen JS, Otzen DE. Pedersen JS, et al. Protein Sci. 2008 Jan;17(1):2-10. doi: 10.1110/ps.073127808. Epub 2007 Nov 27. Protein Sci. 2008. PMID: 18042680 Free PMC article. Review.
Cited by
- Polymorphism of Alpha-Synuclein Amyloid Fibrils Depends on Ionic Strength and Protein Concentration.
Ziaunys M, Sakalauskas A, Mikalauskaite K, Smirnovas V. Ziaunys M, et al. Int J Mol Sci. 2021 Nov 17;22(22):12382. doi: 10.3390/ijms222212382. Int J Mol Sci. 2021. PMID: 34830264 Free PMC article. - Expanding the repertoire of amyloid polymorphs by co-polymerization of related protein precursors.
Sarell CJ, Woods LA, Su Y, Debelouchina GT, Ashcroft AE, Griffin RG, Stockley PG, Radford SE. Sarell CJ, et al. J Biol Chem. 2013 Mar 8;288(10):7327-37. doi: 10.1074/jbc.M112.447524. Epub 2013 Jan 17. J Biol Chem. 2013. PMID: 23329840 Free PMC article. - Source genotype influence on cross species transmission of transmissible spongiform encephalopathies evaluated by RT-QuIC.
Hwang S, Greenlee JJ, Vance NM, Nicholson EM. Hwang S, et al. PLoS One. 2018 Dec 20;13(12):e0209106. doi: 10.1371/journal.pone.0209106. eCollection 2018. PLoS One. 2018. PMID: 30571737 Free PMC article. - Amyloidogenic cross-seeding of Tau protein: Transient emergence of structural variants of fibrils.
Nizynski B, Nieznanska H, Dec R, Boyko S, Dzwolak W, Nieznanski K. Nizynski B, et al. PLoS One. 2018 Jul 19;13(7):e0201182. doi: 10.1371/journal.pone.0201182. eCollection 2018. PLoS One. 2018. PMID: 30024984 Free PMC article. - Distinct stability states of disease-associated human prion protein identified by conformation-dependent immunoassay.
Choi YP, Peden AH, Gröner A, Ironside JW, Head MW. Choi YP, et al. J Virol. 2010 Nov;84(22):12030-8. doi: 10.1128/JVI.01057-10. Epub 2010 Sep 15. J Virol. 2010. PMID: 20844046 Free PMC article.
References
- Dobson, C. M. (2002) Trends Biochem. Sci. 24 329-332 - PubMed
- Tycko, R. (2006) Q. Rev. Biophys. 1-55 - PubMed
- Diaz-Avalos, R., Long, C., Fontano, E., Balbirnie, M., Grothe, R., Eisenberg, D., and Caspar, D. L. D. (2003) J. Mol. Biol. 330 1165-1175 - PubMed
- Petkova, A. T., Leapman, R. D., Gua, Z., Yau, W.-M., Mattson, M. P., and Tycko, R. (2005) Science 307 262-265 - PubMed
Publication types
MeSH terms
Substances
LinkOut - more resources
Full Text Sources
Research Materials
