Age-related myelin dynamics revealed by increased oligodendrogenesis and short internodes - PubMed (original) (raw)
Age-related myelin dynamics revealed by increased oligodendrogenesis and short internodes
Jurate Lasiene et al. Aging Cell. 2009 Apr.
Abstract
Aging is associated with many functional and morphological central nervous system changes. It is important to distinguish between changes created by normal aging and those caused by disease. In the present study we characterized myelin changes within the murine rubrospinal tract and found that internode lengths significantly decrease as a function of age which suggests active remyelination. We also analyzed the proliferation, distribution and phenotypic fate of dividing cells with Bromodeoxyuridine (5-bromo-2-deoxyuridine, BrdU). The data reveal a decrease in glial cell proliferation from 1 to 6, 14 and 21 months of age in gray matter 4 weeks post-BrdU injections. However, we found an increase in gliogenesis at 21st month in white matter of the spinal cord. Half of newly generated cells expressed NG2. Most cells were positive for the early oligodendrocyte marker Olig2 and a few also expressed CC1. Very few cells ever became positive for the astrocytic markers S100beta or GFAP. These data demonstrate ongoing oligodendrogenesis and myelinogenesis as a function of age in the spinal cord.
Figures
Figure 1
(A) Fluoro-Ruby injections in the red nuclei resulted in well filled rubrospinal axons (RST) (red) that co-labeled with CASPR (green). The image is a confocal z-stack reconstruction (~70μm thick) of the RST from a 21 month old animal. Arrows indicate readily apparent internodes. Scale =20μm. (B) A single internode imaged from the tissue section in A. This image is a 45-degree rotation in the x and y plane of the original confocal z-stack. The Green line demarcates an orthogonal view taken at the x axis and the blue line demarcates an orthogonal view taken at the y axis. Note the tight clustering of CASPR labeling can be clearly visualized at the paranode. Scale =10μm. (C) RST internode lengths significantly decrease as a function of age from 2.5 to 14 and 21 months (P<0.001).
Figure 2
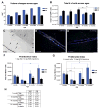
(A) Total cord volume measurements for both WM and GM. There were no significant differences (t-test, two-tailed, P>0.05). (B) Total cells number measured as (DAPI+ nuclei/mm3)*GM or WM volume significantly decreased from 6 to 14 and 21 months both in GM. (C) BrdU+ nuclei revealed by DAB staining were readily observed in WM and GM. Scale = 75μm. Dividing cells were frequently observed at the central canal in 1 month old animals (D) whereas in all other ages BrdU+ cells were found mostly outside of the central canal region (E). Scale = 75μm. (F) Total cell proliferation significantly increased from 6 to 21 month old animals in WM 1 day p.i. (ANOVA, Tukey’s test, P<0.01). (G) Total cell numbers significantly increased from 6 to 21 months in WM 4 weeks p.i. (ANOVA, Tukey’s test, P<0.01). In GM total BrDU+ cell significantly decreased from 1 to 6, 14 and 21 months (ANOVA, Tukey’s test, P<0.001 and P<0.05 respectively). (H) 1 day p.i. there was a significant increase in BrdU+ cell percentage in WM from 6 to 21 month old animals and in GM from 6 to 14 month old (ANOVA, Tukey’s test, P<0.05). 4 weeks p.i. there was a significant increase in BrdU+ cell percentage in WM between 6 month and 21 month olds (ANOVA, Tukey’s test, P<0.01) and in GM there was a significant decrease in cell percentage between 1 month and 6 and 14 month olds (ANOVA, Tukey’s test, P<0.01 and P<0.05 respectively).
Figure 3
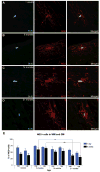
BrdU and NG2 co-labeled cells typically exhibited the complex morphology of polydendrocytes in WM in all the ages examined. No gross changes in NG2-cell morphology were noted across age. Scale =15μm (A–D). (E) There was a significant decrease in BrdU+/NG2+ cells 4 weeks p.i. between 6 to 21 months of age in both GM and WM (P<0.01 and P<0.05).
Figure 4
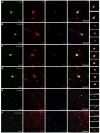
Examples of the morphology and co-localization pattern of phenotype markers used for quantification. CC1 and Olig2 co-localization pattern with BrdU was similar across ages in WM. Scale =25μm (A–D). Oligodendrocytes were classified as being positive for both CC1 and Olig2 markers. A confocal z-series allows examination of cells through their entire z-axis in 2 μm steps. Dividing cells very rarely co-localized with astrocytic labels GFAP and S100β. Scale =40μm (E–F).
Figure 5
Quantification of BrdU labeled cell phenotypes. BrdU+ cells were determined whether they co-localized with oligodendrocytic CC1 and Olig2 markers. Majority of the BrdU+ cells co-labeled with Olig2 (black and white bars) both in GM and WM, 1 day and 4 weeks p.i. (A–D). There were some cells that did not co-label with either CC1 or Olig2 marker (blue). There were no significant differences in phenotype acquisition across ages. (E–H) Most cells were GFAP/S100β negative which indicated that astrogenesis was extremely low.
Similar articles
- LINGO-1 negatively regulates myelination by oligodendrocytes.
Mi S, Miller RH, Lee X, Scott ML, Shulag-Morskaya S, Shao Z, Chang J, Thill G, Levesque M, Zhang M, Hession C, Sah D, Trapp B, He Z, Jung V, McCoy JM, Pepinsky RB. Mi S, et al. Nat Neurosci. 2005 Jun;8(6):745-51. doi: 10.1038/nn1460. Epub 2005 May 15. Nat Neurosci. 2005. PMID: 15895088 - Differential clustering of Caspr by oligodendrocytes and Schwann cells.
Eisenbach M, Kartvelishvily E, Eshed-Eisenbach Y, Watkins T, Sorensen A, Thomson C, Ranscht B, Barnett SC, Brophy P, Peles E. Eisenbach M, et al. J Neurosci Res. 2009 Nov 15;87(15):3492-501. doi: 10.1002/jnr.22157. J Neurosci Res. 2009. PMID: 19565653 - Leukemia inhibitory factor regulates the timing of oligodendrocyte development and myelination in the postnatal optic nerve.
Ishibashi T, Lee PR, Baba H, Fields RD. Ishibashi T, et al. J Neurosci Res. 2009 Nov 15;87(15):3343-55. doi: 10.1002/jnr.22173. J Neurosci Res. 2009. PMID: 19598242 Free PMC article. - Multiple functions of the paranodal junction of myelinated nerve fibers.
Rosenbluth J. Rosenbluth J. J Neurosci Res. 2009 Nov 15;87(15):3250-8. doi: 10.1002/jnr.22013. J Neurosci Res. 2009. PMID: 19224642 Review. - The Effects of the Olig Family on the Regulation of Spinal Cord Development and Regeneration.
Liu Y, Long ZY, Yang C. Liu Y, et al. Neurochem Res. 2021 Nov;46(11):2776-2782. doi: 10.1007/s11064-021-03383-1. Epub 2021 Jul 6. Neurochem Res. 2021. PMID: 34228233 Review.
Cited by
- Myelin remodeling through experience-dependent oligodendrogenesis in the adult somatosensory cortex.
Hughes EG, Orthmann-Murphy JL, Langseth AJ, Bergles DE. Hughes EG, et al. Nat Neurosci. 2018 May;21(5):696-706. doi: 10.1038/s41593-018-0121-5. Epub 2018 Mar 19. Nat Neurosci. 2018. PMID: 29556025 Free PMC article. - Age attenuates the transcriptional changes that occur with sleep in the medial prefrontal cortex.
Guo X, Keenan BT, Sarantopoulou D, Lim DC, Lian J, Grant GR, Pack AI. Guo X, et al. Aging Cell. 2019 Dec;18(6):e13021. doi: 10.1111/acel.13021. Epub 2019 Sep 24. Aging Cell. 2019. PMID: 31549781 Free PMC article. - NG2-glia as multipotent neural stem cells: fact or fantasy?
Richardson WD, Young KM, Tripathi RB, McKenzie I. Richardson WD, et al. Neuron. 2011 May 26;70(4):661-73. doi: 10.1016/j.neuron.2011.05.013. Neuron. 2011. PMID: 21609823 Free PMC article. Review. - DNA damage in the oligodendrocyte lineage and its role in brain aging.
Tse KH, Herrup K. Tse KH, et al. Mech Ageing Dev. 2017 Jan;161(Pt A):37-50. doi: 10.1016/j.mad.2016.05.006. Epub 2016 May 26. Mech Ageing Dev. 2017. PMID: 27235538 Free PMC article. Review. - Developmental Origin of Oligodendrocyte Lineage Cells Determines Response to Demyelination and Susceptibility to Age-Associated Functional Decline.
Crawford AH, Tripathi RB, Richardson WD, Franklin RJM. Crawford AH, et al. Cell Rep. 2016 Apr 26;15(4):761-773. doi: 10.1016/j.celrep.2016.03.069. Epub 2016 Apr 14. Cell Rep. 2016. PMID: 27149850 Free PMC article.
References
- Adrian EK, Jr, Walker BE. Incorporation of thymidine-H3 by cells in normal and injured mouse spinal cord. Journal of neuropathology and experimental neurology. 1962;21:597–609. - PubMed
- Agid Y. Parkinson’s disease: pathophysiology. Lancet. 1991;337:1321–1324. - PubMed
- Albert ML, Knoefel JE. Clinical neurology of aging. New York: Oxford University Press; 1994.
- Amenta F, Bronzetti E, Sabbatini M, Vega JA. Astrocyte changes in aging cerebral cortex and hippocampus: a quantitative immunohistochemical study. Microscopy research and technique. 1998;43:29–33. - PubMed
- Bhat RV, Axt KJ, Fosnaugh JS, Smith KJ, Johnson KA, Hill DE, Kinzler KW, Baraban JM. Expression of the APC tumor suppressor protein in oligodendroglia. Glia. 1996;17:169–174. - PubMed
Publication types
MeSH terms
Substances
LinkOut - more resources
Full Text Sources
Other Literature Sources
Medical
Miscellaneous


