Vasculature guides migrating neuronal precursors in the adult mammalian forebrain via brain-derived neurotrophic factor signaling - PubMed (original) (raw)
. 2009 Apr 1;29(13):4172-88.
doi: 10.1523/JNEUROSCI.4956-08.2009.
Morgane Lemasson, Monika S Brill, Mathieu Blais, Mireille Massouh, Jovica Ninkovic, Claude Gravel, François Berthod, Magdalena Götz, Philip A Barker, André Parent, Armen Saghatelyan
Affiliations
- PMID: 19339612
- PMCID: PMC6665362
- DOI: 10.1523/JNEUROSCI.4956-08.2009
Vasculature guides migrating neuronal precursors in the adult mammalian forebrain via brain-derived neurotrophic factor signaling
Marina Snapyan et al. J Neurosci. 2009.
Abstract
Adult neuronal precursors retain the remarkable capacity to migrate long distances from the posterior (subventricular zone) to the most anterior [olfactory bulb (OB)] parts of the brain. The knowledge about the mechanisms that keep neuronal precursors in the migratory stream and organize this long-distance migration is incomplete. Here we show that blood vessels precisely outline the migratory stream for new neurons in the adult mammalian forebrain. Real-time video imaging of cell migration in the acute slices demonstrate that neuronal precursors are retained in the migratory stream and guided into the OB by blood vessels that serve as a physical substrate for migrating neuroblasts. Our data suggest that endothelial cells of blood vessels synthesize brain-derived neurotrophic factor (BDNF) that fosters neuronal migration via p75NTR expressed on neuroblasts. Interestingly, GABA released from neuroblasts induces Ca(2+)-dependent insertion of high-affinity TrkB receptors on the plasma membrane of astrocytes that trap extracellular BDNF. We hypothesize that this renders BDNF unavailable for p75NTR-expressing migrating cells and leads to their entrance into the stationary period. Our findings provide new insights into the functional organization of substrates that facilitate the long-distance journey of adult neuronal precursors.
Figures
Figure 1.
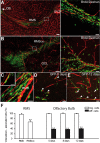
Migrating neuroblasts are aligned along the blood vessels in the adult brain. A, B, Micrographs showing organization of blood vessels in the adult mouse forebrain. Note the close association of tangentially (A) and radially (B) migrating neuronal precursors (green) with blood vessels (red) that parallel the migratory stream. Newly generated cells in the migratory pathway were labeled by BrdU injection 5 d before analysis. Blood vessels were revealed by injection of dextran–Texas Red to the tail vein. Scale bars: A, B, 100 μm; Aright, Bright, 20 μm. C–E, Vasculature-associated GFP+ cells in the RMS and OB. GFP-expressing retrovirus was injected into the SVZ (C) or RMS (D, E) 5, 8, and 12 d before analysis. Arrowheads and arrows indicate migrating (mig.) and differentiating (diff.) cells, respectively. Scale bars, 10 μm. F, Quantification of vasculature-associated cells in the RMS and OB.
Figure 2.
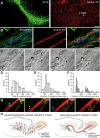
Neuronal precursors migrate along the blood vessels in the adult brain. A, GFAP-labeled astrocytes (green) and dextran–Texas Red (TR)-labeled blood vessels (red) in the adult RMS. Note the parallel organization of blood vessels in the RMS. Scale bar, 100 μm. B, Micrographs of BrdU-positive cells (5 d after BrdU injection) in the close vicinity of dextran–Texas Red-loaded blood vessels (injection to the tail vein). GFAP-labeled astrocytes (green) envelop blood vessels (red), and neuroblasts (blue) are attached to the astrocytic processes. Scale bar, 10 μm. C, Time-lapse video imaging of migrating neuroblasts in slices from the adult mouse forebrain (time is indicated in minutes in the top right corner of each photograph). Migrating cells are indicated during their migratory (arrows only) and stationary (arrows with asterisks) phases. D–F, Rate of migration and durations of migratory and stationary periods of neuronal precursors in the RMS in the acute slices of mouse forebrain. G, GFP-labeled neuronal precursors migrate along blood vessels in the acute slices of the adult mouse forebrain. Blood vessels were labeled by injection of dextran–Texas Red to the tail vein 1 h before preparation of acute slices. GFP-expressing retrovirus was injected into the SVZ 3 d before time-lapse imaging in the RMS. Arrows indicate the soma of migratory cells, whereas asterisk shows leading process. Note that GFP+ cells are always positioned close to the vasculature either with their soma or leading processes. Time is indicated in minutes in the top right corner of each photograph. Scale bar, 10 μm. H, Schematic representation of the adult brain showing the migratory pathway. According to the repellent/attraction-guided model, neuroblasts remain in this complex-shaped migratory stream because of myriads of chemorepellent molecules (black arrows) secreted from all RMS-neighboring territories and are guided toward OB attributable to chemoattractive molecules secreted from the this region (green arrows). According to the vasculature-guided migration model proposed herein, neuroblasts are retained in the RMS and migrate in this pathway as a result of the presence of blood vessels that are oriented parallel to the migratory stream. Neuroblasts course along blood vessels, and a single chemorepellent molecule that is secreted from the posterior parts of the brain could be sufficient to direct neuronal precursors to the OB. Neuroblasts receive all other signal(s) for their migration from RMS–OB vasculature. It should be noted, however, that the vasculature-guided migration model proposed here does not exclude the earlier chemorepellent/chemoattraction-mediated scheme. It is likely that both mechanisms operate in parallel to ensure faithful migration of newborn cells in the adult brain.
Figure 3.
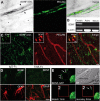
Expression of BDNF in the adult RMS. A, In situ hybridization (ISH) for BDNF and immunostaining for PECAM (green) showing that endothelial cells of blood vessels synthesize BDNF. Note that BDNF mRNA is present in the endothelial cells (arrowheads) but not in other cell types of the adult RMS (asterisks). Scale bar, 5 μm. B, RT-PCR analysis of FACS-purified endothelial cells (Endoth.), astrocytes (Astro), and neuroblasts (Neuro). BDNF is expressed in endothelial cells but not in astrocytes and neuroblasts. C, Immunostaining for BDNF in the adult mouse RMS. Inset shows colocalization of BDNF (green) and GFAP (red). Scale bar, 10 μm. D, Immunostaining for BDNF (green) and GFAP (red) in the adult mouse RMS after osmotic minipump infusion of TrkB–Fc or IgG–Fc, as a control. BDNF immunostaining is drastically reduced after 7 d of TrkB–Fc infusion. Scale bar, 10 μm. E, Coculture of astrocytes with BDNF–GFP-transfected endothelial cells. Note the strong GFP signal in the endothelial cells and punctate staining (arrows) of astrocyte. Bright-field (BF) images are also shown. Bleaching area is indicated by the red square. After 8 min of recovery period, the punctate staining reappears at the surface of astrocyte. Scale bar, 10 μm.
Figure 4.
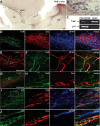
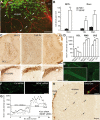
Expression of TrkB and p75NTR in the adult RMS. A, In situ hybridization for TrkB in the adult SVZ–OB pathway. Note the intense labeling in the adult RMS. Scale bar, 100 μm. LV, Lateral ventricle; Str, striatum. B, High-magnification images of the boxed areas in A. Scale bar, 10 μm. C, RT-PCR analysis of FACS-purified astrocytes (GFAP) and neuroblasts (PSA-NCAM). Note the high level of expression of p75NTR in neuroblasts and TrkB receptors in astrocytes. D, Immunostaining for TrkB (green), Dcx (red), and GFAP (blue) in the adult mouse RMS. Scale bar, 100 μm. E, F, Immunostaining for TrkB (green) and GFAP (red) in the adult mouse RMS. F, High-magnification images of the boxed area in E. Scale bars: E, 100 μm; F, 10 μm. G, H, Micrographs showing that most, if not all, of TrkB (green) immunopositivity is not localized in Dcx-immunopositive cells (red). H, High-magnification images of the boxed area in G. Scale bars: G, 100 μm; H, 10 μm. I, J, Micrographs displaying expression of p75NTR (green) by migrating neuroblasts (Dcx, red). J, High-magnification images of the boxed area in (I). Scale bar, 10 μm.
Figure 5.
BDNF induces vasculature-associated cell migration in the adult forebrain. A, Micrographs illustrating migration of GFP+ neuroblasts into the striatum 3 d after stereotaxic injection of BDNF (100 ng) to this region. GFP-expressing retrovirus was injected into the SVZ 2 d before injection of BDNF. Note that numerous migrating neuroblasts (arrows) use blood vessels for their navigation into the striatum. LV, Lateral ventricle. Scale bar, 100 μm. B, Quantification of the density of GFP+ and Dcx+ derouted cells in the striatum. C, Micrographs showing BrdU+ cells in the OB and SVZ/RMS 7 d after osmotic minipump infusions of IgG–Fc (10–90 μg/ml), TrkB–Fc (10 μg/ml), and p75NTR function-blocking antibodies (90 μg/ml) just above horizontal limb of the RMS. BrdU was injected 2 d before osmotic minipump installation. Note the reduced number of BrdU+ cells in the OB and increased number in the SVZ/RMS of TrkB–Fc and p75NTR function-blocking antibody infused animals. Scale bar, 100 μm. D, Density of BrdU+ cells in the granule cell layer (GCL) of the OB, RMS, and SVZ of IgG–Fc, TrkB–Fc, and p75NTR function-blocking antibody infused animals. E, Labeling of blood vessels after osmotic minipump infusion of fluorescently tagged BDNF siRNA to the carotid artery. Control and BDNF siRNAs were infused for 7 d. Inset shows high-magnification image of fluorescently tagged siRNA-labeled blood vessel. Scale bars: E, 50 μm; inset, 10 μm. F, Immunostaining for BDNF in the control and BDNF siRNAs-treated animals. Note the reduced intensity of immunostaining. Scale bar, 20 μm. G, Density of BrdU+ cells in the SVZ–OB pathway after control (black squares) and BDNF (gray squares) siRNA infusion to the carotid artery. Single pulse of BrdU was given 6 h before installation of osmotic minipumps. BrdU+ cells were counted in the coronal sections spaced by 120 μm throughout the SVZ–OB pathway. H, Micrographs displaying BrdU+ cells in the RMS of BDNF siRNA-treated animals. Note that numerous BrdU+ cells (arrows) leave RMS and migrate to the striatum. Inset shows high-magnification image of BrdU (green) and Dcx (red) colabeled cell in the striatum. Scale bars: H, 100 μm; inset, 10 μm.
Figure 6.
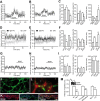
BDNF fosters neuronal migration via p75NTR. A, B, Individual experiment demonstrating that bath application of BDNF (10 ng/ml) increases the average distance that migrating cells propagate (A) and raises the percentage of cells that are in the migratory phase at each time point (B). The time period for BDNF application is shown by a black line. C, Summary graph showing the effect of BDNF or TrkB–Fc (1 μg/ml) applications on the average distance that migratory cells propagate (per 15 s), the percentage of cells in the migratory phase, and the duration of the stationary period. In control experiments, IgG–Fc (1 μg/ml) was applied instead of TrkB–Fc. D, E, Summary graphs showing that preincubation of slices with p75NTR function-blocking antibodies drastically decreases the average distance that migrating cells propagate (D) and reduces percentage of cells in the migratory phase at each time point (E). The time-lapse recording was performed after preincubation of slices in either p75NTR function-blocking antibodies or IgG–Fc (20 μg/ml) for 1 h. During the entire period of recording, the slices were continuously perfused with oxygenated ACSF (2 ml/min). Note that the blocking effect of p75NTR function-blocking antibodies is washed out during recording. F, Summary graph showing that deficiency in p75NTR and application of p75NTR function-blocking antibodies affects the average distance that migratory cells propagate (per 15 s), the percentage of cells in the migratory phase, and the duration of the stationary period. G, H, Individual experiment demonstrating that bath application of BDNF (10 ng/ml) does not affect the average distance that migrating cells propagate (G) and the percentage of cells in the migratory phase at each time point (H) in the slices prepared from p75NTR-deficient animals. I, Summary graph showing the absence of effect of BDNF and TrkB–Fc applications on the average distance that migratory cells propagate (per 15 s), the percentage of cells in the migratory phase, and the stationary period duration in p75NTR-deficient animals. J, Micrograph illustrating GFP+ tissue-engineered 3D capillary-like network in vitro. Scale bar, 30 μm. K, Immunostaining for BDNF (red) and PECAM (green) in the transversal sections of sponges containing capillary-like network. Scale bar, 50 μm. L, Micrograph depicting GAD67–GFP+ neuroblasts (green) cocultured in 3D capillary-like network (red). HUVEC cells were transduced with GFP lentivirus. GFP+ neuroblasts (small cells of ∼5–10 μm size) and GFP+ capillaries (long tubular-like structures) were easily distinguishable on the basis of their shapes and were false-colored in offline analysis using ImagePro software. Note that neuroblasts accumulate along the capillaries, and places that do not contain these capillary-like structures (asterisks) are also free of neuroblasts. Scale bar, 20 μm. M, Quantification of neuroblast migration in the capillary-like network under different experimental conditions. Note the increased migration of neuronal precursors in the cultures containing capillary-like structure compared with the control fibroblast containing cultures (Fibro). Note also that BDNF siRNA and p75NTR function-blocking antibodies reduce the migration of neuronal precursors. Distance of migration (per 15 s) was calculated in the images acquired every 15 s for at least 1 h. Inset shows semiquantitative RT-PCR analysis of BDNF expression in the endothelial cells after siRNA transfection. KO, Knock-out; WT, wild type; BV, blood vessels.
Figure 7.
GABAergic signaling affects Ca2+ activity in astrocytes and migration of neuroblasts. A, Application of GABAA receptor antagonist bicuculline (Bic, 100 μ
m
) diminishes spontaneous Ca2+ fluctuations in the astrocytes. Time-lapse video imaging illustrating changes in the fluorescent intensity under control conditions (left panels) and after application of bicuculline (right panels) over time (indicated in seconds in the top right corner of each photograph). Scale bar, 10 μm. B, Individual experiments demonstrating that bath application of GABA (10 μm) after application of TrkB–Fc (1 μg/ml) as well as TrkB–Fc application after GABA application do not affect the average distance that migrating cells propagate. The time periods for TrkB–Fc and GABA applications are shown by black lines. Each time point represents the average value for 20–30 cells. C, Summary graphs illustrating that bath application of GABA (10 μm) after application of TrkB–Fc (1 μg/ml) and bath application of TrkB–Fc (1 μg/ml) after application of GABA (10 μm) do not affect the average distance that migrating cells propagate (per 15 s), the percentage of cells in the migratory phase, and the duration of stationary period.
Figure 8.
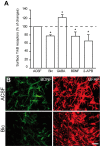
GABA induces insertion of TrkB receptors on membrane of astrocytes. A, Preincubation of slices with bicuculline (Bic; 100 μ
m
), BDNF (10 ng/ml), or 2-APB (100 μ
m
) for 1 h reduces amount of surface TrkB receptors. In contrast, treatment with GABA (10 μ
m
for 1 h) increases the amount of surface TrkB receptors. The cell-surface molecules of freshly isolated cells, extracted from RMS, were labeled with Sulfo-NHS-biotin. Cell lysates were precipitated with streptavidin-coated agarose beads and immunolabeled with TrkB antibodies. The amount of surface TrkB receptors was analyzed by ELISA. B, Incubation of acute slices of the adult mouse forebrain with bicuculline (100 μ
m
) decreases immunolabeling for BDNF in the adult RMS. Scale bar, 10 μm.
Similar articles
- Brain-derived neurotrophic factor promotes vasculature-associated migration of neuronal precursors toward the ischemic striatum.
Grade S, Weng YC, Snapyan M, Kriz J, Malva JO, Saghatelyan A. Grade S, et al. PLoS One. 2013;8(1):e55039. doi: 10.1371/journal.pone.0055039. Epub 2013 Jan 29. PLoS One. 2013. PMID: 23383048 Free PMC article. - Time-lapse imaging of neuroblast migration in acute slices of the adult mouse forebrain.
Khlghatyan J, Saghatelyan A. Khlghatyan J, et al. J Vis Exp. 2012 Sep 12;(67):e4061. doi: 10.3791/4061. J Vis Exp. 2012. PMID: 23007608 Free PMC article. - Dynamic imaging reveals that brain-derived neurotrophic factor can independently regulate motility and direction of neuroblasts within the rostral migratory stream.
Bagley JA, Belluscio L. Bagley JA, et al. Neuroscience. 2010 Sep 1;169(3):1449-61. doi: 10.1016/j.neuroscience.2010.05.075. Epub 2010 Jun 9. Neuroscience. 2010. PMID: 20538046 Free PMC article. - Control of neuroblast production and migration by converging GABA and glutamate signals in the postnatal forebrain.
Platel JC, Dave KA, Bordey A. Platel JC, et al. J Physiol. 2008 Aug 15;586(16):3739-43. doi: 10.1113/jphysiol.2008.155325. Epub 2008 May 8. J Physiol. 2008. PMID: 18467361 Free PMC article. Review. - A tissue-engineered rostral migratory stream for directed neuronal replacement.
O'Donnell JC, Katiyar KS, Panzer KV, Cullen DK. O'Donnell JC, et al. Neural Regen Res. 2018 Aug;13(8):1327-1331. doi: 10.4103/1673-5374.235215. Neural Regen Res. 2018. PMID: 30106034 Free PMC article. Review.
Cited by
- (R,S)-Ketamine Promotes Striatal Neurogenesis and Sensorimotor Recovery Through Improving Poststroke Depression-Mediated Decrease in Atrial Natriuretic Peptide.
Zhang Y, Xie B, Yuan Y, Zhou T, Xiao P, Wu Y, Shang Y, Yuan S, Zhang J. Zhang Y, et al. Biol Psychiatry Glob Open Sci. 2021 Apr 22;1(2):90-100. doi: 10.1016/j.bpsgos.2021.04.002. eCollection 2021 Aug. Biol Psychiatry Glob Open Sci. 2021. PMID: 36324997 Free PMC article. - The impact of cerebrovascular aging on vascular cognitive impairment and dementia.
Yang T, Sun Y, Lu Z, Leak RK, Zhang F. Yang T, et al. Ageing Res Rev. 2017 Mar;34:15-29. doi: 10.1016/j.arr.2016.09.007. Epub 2016 Sep 28. Ageing Res Rev. 2017. PMID: 27693240 Free PMC article. Review. - BDNF-Live-Exon-Visualization (BLEV) Allows Differential Detection of BDNF Transcripts in vitro and in vivo.
Singer W, Manthey M, Panford-Walsh R, Matt L, Geisler HS, Passeri E, Baj G, Tongiorgi E, Leal G, Duarte CB, Salazar IL, Eckert P, Rohbock K, Hu J, Strotmann J, Ruth P, Zimmermann U, Rüttiger L, Ott T, Schimmang T, Knipper M. Singer W, et al. Front Mol Neurosci. 2018 Sep 27;11:325. doi: 10.3389/fnmol.2018.00325. eCollection 2018. Front Mol Neurosci. 2018. PMID: 30319348 Free PMC article. - mRNA Abundance of Neurogenic Factors Correlates with Hearing Capacity in Auditory Brainstem Nuclei of the Rat.
Engert J, Doll J, Vona B, Ehret Kasemo T, Spahn B, Hagen R, Rak K, Voelker J. Engert J, et al. Life (Basel). 2023 Sep 2;13(9):1858. doi: 10.3390/life13091858. Life (Basel). 2023. PMID: 37763262 Free PMC article. - Reelin controls progenitor cell migration in the healthy and pathological adult mouse brain.
Courtès S, Vernerey J, Pujadas L, Magalon K, Cremer H, Soriano E, Durbec P, Cayre M. Courtès S, et al. PLoS One. 2011;6(5):e20430. doi: 10.1371/journal.pone.0020430. Epub 2011 May 27. PLoS One. 2011. PMID: 21647369 Free PMC article.
References
- Alderson RF, Curtis R, Alterman AL, Lindsay RM, DiStefano PS. Truncated TrkB mediates the endocytosis and release of BDNF and neurotrophin-4/5 by rat astrocytes and schwann cells in vitro. Brain Res. 2000;871:210–222. - PubMed
- Altman J, Das GD. Autoradiographic and histological studies of postnatal neurogenesis. I. A longitudinal investigation of the kinetics, migration and transformation of cells incorporating tritiated thymidine in neonate rats, with special reference to postnatal neurogenesis in some brain regions. J Comp Neurol. 1966;126:337–389. - PubMed
- Anton ES, Ghashghaei HT, Weber JL, McCann C, Fischer TM, Cheung ID, Gassmann M, Messing A, Klein R, Schwab MH, Lloyd KC, Lai C. Receptor tyrosine kinase ErbB4 modulates neuroblast migration and placement in the adult forebrain. Nat Neurosci. 2004;7:1319–1328. - PubMed
Publication types
MeSH terms
Substances
LinkOut - more resources
Full Text Sources
Other Literature Sources
Molecular Biology Databases
Miscellaneous
