A primary xenograft model of small-cell lung cancer reveals irreversible changes in gene expression imposed by culture in vitro - PubMed (original) (raw)
A primary xenograft model of small-cell lung cancer reveals irreversible changes in gene expression imposed by culture in vitro
Vincent C Daniel et al. Cancer Res. 2009.
Abstract
Traditional approaches to the preclinical investigation of cancer therapies rely on the use of established cell lines maintained in serum-based growth media. This is particularly true of small-cell lung cancer (SCLC), where surgically resected tissue is rarely available. Recent attention has focused on the need for better models that preserve the integrity of cancer stem cell populations, as well as three-dimensional tumor-stromal interactions. Here we describe a primary xenograft model of SCLC in which endobronchial tumor specimens obtained from chemo-naive patients are serially propagated in vivo in immunodeficient mice. In parallel, cell lines grown in conventional tissue culture conditions were derived from each xenograft line, passaged for 6 months, and then reimplanted to generate secondary xenografts. Using the Affymetrix platform, we analyzed gene expression in primary xenograft, xenograft-derived cell line, and secondary xenograft, and compared these data to similar analyses of unrelated primary SCLC samples and laboratory models. When compared with normal lung, primary tumors, xenografts, and cell lines displayed a gene expression signature specific for SCLC. Comparison of gene expression within the xenograft model identified a group of tumor-specific genes expressed in primary SCLC and xenografts that was lost during the transition to tissue culture and that was not regained when the tumors were reestablished as secondary xenografts. Such changes in gene expression may be a common feature of many cancer cell culture systems, with functional implications for the use of such models for preclinical drug development.
Conflict of interest statement
Conflict of Interest: DN Watkins is a former paid consultant for Genentech Inc., with no ongoing financial interest. CD Peacock received salary support through a gift from Genentech Inc.
Figures
Figure 1
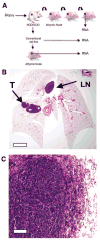
Generation and characterization of the SCLC primary xenograft model. A, Outline of the experimental approach from primary sample, xenograft, cell line and secondary xenograft from the derived cell line. B, H&E stained section of mouse lungs following orthotopic injection of the LX22 xenograft. The “primary” tumor (T) and metastasis in mediastinal lymph node (LN) are highlighted. Scale bar = 1mm C, H&E stained section of the intrapulmonary tumor shown in B. Scale bar = 20μm.
Figure 2
Differential Expression Analysis in the Primary Xenograft Model. A, Venn Diagram showing the number of differentially expressed genes (adjusted P-value < 0.005) in direct comparisons among primary xenografts (XG), the matched cell lines (CL), the xenografts obtained from these cell lines (CLX). Only 26 genes were differentially expressed between CL and CLX (CLvsCLX), 152 between XG and CLX (XGvsCLX), and 395 between XG and CL (XGvsCL). B, Hierarchical clustering of pair-wise squared correlations between distinct groups of samples. Matched triplets of samples are denoted as XG, CL, and CLX, while pairs of independent samples from established cell lines and from the public domain (CL and CLX) are denoted by the prefix ‘p’. All correlations were computed between mean fold-changes of each sample group compared to the universal reference RNA (Strategene). Comparisons involving CL and CLX groups (CLvsREF, CLXvsREF, CLvsREF, pCLXvsREF) proved to be more correlated than any other comparison involving the primary xenografts group (XGvsREF). C, Correspondence-at-the-top plots (CAT-plots) for all pair-wise comparisons among triplets and pairs of samples. The notation is used is the same as in C. Genes were ranked by the mean fold-change of each sample group compared to the universal reference RNA. On the left is shown the correspondence for the most down regulated genes (4000), and on right for the most up regulated genes (400). The red and the blue lines on the top of the CAT-plot represent the comparisons between CL and CLX for matched triplets and pairs of samples, and show the highest correspondence. For the up-regulated genes, the purple line represents the comparison between cell lines derived from our xenografts (CL) and cell lines from the public domain (pCL). This comparison shows more similarity than when XG are compared to CL.
Figure 3
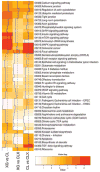
Analysis of Functional Annotation (AFA). Heat-map showing AFA results for KEGG pathways. Color-coded values correspond to absolute values of base 10 logarithms of raw P-values from the Wilcoxon rank sum test. Vertical blue lines show the same data as a histogram value for each color intensity. All pathways shown proved to be enriched in at least one comparison (adjusted P-value < 0.05). Rows were clustered using Euclidian distance and the average clustering method; columns were not reordered. Several pathways showed significant results changes in all comparisons, although different sets of genes proved to be responsible for the enrichment, while a number of pathways (i.e. Keratan sulfate biosynthesis) proved to be enriched in a subset of the contrasts considered (see Supplementary Tables A–C for genes involved and analysis of additional functional scopes, including Gene Ontology).
Figure 4
Comparison between laboratory model samples and primary small cell lung cancer (SCLC) specimens. (A) Venn diagram showing the number of differentially expressed genes (adjusted P-value < 0.005) in direct comparisons among primary xenografts (XG), the matched cell lines (CL), the xenografts obtained from these cell lines (CLX) and the group of primary SCLC. A group of 543 genes proved to be differentially expressed between all laboratory model groups (XG, CL, and CLX) and the primary SCLC. This group of genes accounts for genes expressed in cell types present only in primary tumors, such as genes expressed in lymphocytes, stromal cells present in the primary SCLC, and represent the difference in complexity between specimens obtain in vivo with respect to the laboratory models. A number of genes proved different between each group (XG, CL, and CLX) and the primary SCLC: only 91 genes were differentially expressed between XG and SCLC, while 174 were genes differentially expressed between CL and CLX and SCLC. (B) Hierarchical clustering of all pairwise squared correlations between individual samples, based on gene expression levels after barcode-RMA and quantile normalization. Individual primary Small Cell Lung Cancer (SCLC, cyan), primary xenografts (XG, purple), cell lines (CL, green), and xenografts from these cell lines (CLX, blue) are shown. Correlations were computed using all genes (181) that proved to be differentially expressed (adjusted P-value < 0.05) in any comparison between XG, CL, and CLX and that were present in all platforms. Overall the primary xenografts (XG) proved to be more correlated with the primary SCLC than any other sample. Among primary xenografts (XG), the LX22 sample proved to be more correlated to primary SCLC than to its derivative CL and CLX. (C) Multidimensional scaling plot showing the relationships among all individual SCLC, XG, CL, and CLX samples. SCLC are shown in cyan, XG in purple, CL in green, and CLX in blue. The XG samples from LX22 patient proved to be the most similar to primary SCLC samples than to its derivative CL and CLX.
Figure 5
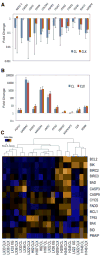
Validation of gene expression genes in the primary SCLC xenograft model. Expression levels in derivative cell lines (CL) and secondary xenografts (CLX) were compared to those in the corresponding primary xenograft, and are shown as the mean of paired data from all three xenograft lines (n=6). Error bars indicate standard errors. Genes selected from the microarray data (shown on the x axis) were upregulated (A) or downregulated (B) relative to expression in the primary xenograft samples. (C) Heat map expression analysis of BCL2-related genes in SCLC models. The RNA samples are listed as columns, and the genes in rows. The color scale represents the level of expression from low (blue) to high (orange).
Similar articles
- Transcriptional gene expression profiling of small cell lung cancer cells.
Pedersen N, Mortensen S, Sørensen SB, Pedersen MW, Rieneck K, Bovin LF, Poulsen HS. Pedersen N, et al. Cancer Res. 2003 Apr 15;63(8):1943-53. Cancer Res. 2003. PMID: 12702587 - Establishment and characterization of five human small cell lung cancer cell lines from early tumor xenografts.
Arvelo F, Poupon MF, Le Chevalier T. Arvelo F, et al. Anticancer Res. 1994 Sep-Oct;14(5A):1893-901. Anticancer Res. 1994. PMID: 7847823 - Achaete-scute complex homologue 1 regulates tumor-initiating capacity in human small cell lung cancer.
Jiang T, Collins BJ, Jin N, Watkins DN, Brock MV, Matsui W, Nelkin BD, Ball DW. Jiang T, et al. Cancer Res. 2009 Feb 1;69(3):845-54. doi: 10.1158/0008-5472.CAN-08-2762. Epub 2009 Jan 27. Cancer Res. 2009. PMID: 19176379 Free PMC article. - Recent advances in the biology of small cell lung cancer.
Carney DN. Carney DN. Chest. 1986 Apr;89(4 Suppl):253S-257S. doi: 10.1378/chest.89.4_supplement.253s. Chest. 1986. PMID: 3007041 Review. - Transitions between lung cancer phenotypes--implications for tumor progression.
Mabry M, Nelkin BD, Falco JP, Barr LF, Baylin SB. Mabry M, et al. Cancer Cells. 1991 Feb;3(2):53-8. Cancer Cells. 1991. PMID: 1851429 Review.
Cited by
- Initiation and characterization of small cell lung cancer patient-derived xenografts from ultrasound-guided transbronchial needle aspirates.
Anderson WC, Boyd MB, Aguilar J, Pickell B, Laysang A, Pysz MA, Bheddah S, Ramoth J, Slingerland BC, Dylla SJ, Rubio ER. Anderson WC, et al. PLoS One. 2015 May 8;10(5):e0125255. doi: 10.1371/journal.pone.0125255. eCollection 2015. PLoS One. 2015. PMID: 25955027 Free PMC article. - Patient-derived xenograft models for pancreatic adenocarcinoma demonstrate retention of tumor morphology through incorporation of murine stromal elements.
Delitto D, Pham K, Vlada AC, Sarosi GA, Thomas RM, Behrns KE, Liu C, Hughes SJ, Wallet SM, Trevino JG. Delitto D, et al. Am J Pathol. 2015 May;185(5):1297-303. doi: 10.1016/j.ajpath.2015.01.016. Epub 2015 Mar 12. Am J Pathol. 2015. PMID: 25770474 Free PMC article. - Single cell analysis of human tissues and solid tumors with mass cytometry.
Leelatian N, Doxie DB, Greenplate AR, Mobley BC, Lehman JM, Sinnaeve J, Kauffmann RM, Werkhaven JA, Mistry AM, Weaver KD, Thompson RC, Massion PP, Hooks MA, Kelley MC, Chambless LB, Ihrie RA, Irish JM. Leelatian N, et al. Cytometry B Clin Cytom. 2017 Jan;92(1):68-78. doi: 10.1002/cyto.b.21481. Epub 2016 Oct 4. Cytometry B Clin Cytom. 2017. PMID: 27598832 Free PMC article. - Establishment and characterization of patient-derived tumor xenograft using gastroscopic biopsies in gastric cancer.
Zhu Y, Tian T, Li Z, Tang Z, Wang L, Wu J, Li Y, Dong B, Li Y, Li N, Zou J, Gao J, Shen L. Zhu Y, et al. Sci Rep. 2015 Feb 25;5:8542. doi: 10.1038/srep08542. Sci Rep. 2015. PMID: 25712750 Free PMC article. - Comparison of the Genetic Alterations between Primary Colorectal Cancers and Their Corresponding Patient-Derived Xenograft Tissues.
Yu SM, Jung SH, Chung YJ. Yu SM, et al. Genomics Inform. 2018 Jun;16(2):30-35. doi: 10.5808/GI.2018.16.2.30. Epub 2018 Jun 30. Genomics Inform. 2018. PMID: 30304923 Free PMC article.
References
- Jemal A, Siegel R, Ward E, Murray T, Xu J, Thun MJ. Cancer statistics, 2007. CA: a cancer journal for clinicians. 2007;57(1):43–66. - PubMed
- Pisick E, Jagadeesh S, Salgia R. Small cell lung cancer: from molecular biology to novel therapeutics. Journal of experimental therapeutics & oncology. 2003;3(6):305–18. - PubMed
- Zochbauer-Muller S, Pirker R, Huber H. Treatment of small cell lung cancer patients. Ann Oncol. 1999;10(Suppl 6):83–91. - PubMed
- Pandita A, Aldape KD, Zadeh G, Guha A, James CD. Contrasting in vivo and in vitro fates of glioblastoma cell subpopulations with amplified EGFR. Genes Chromosomes Cancer. 2004;39(1):29–36. - PubMed
- De Witt Hamer PC, Van Tilborg AA, Eijk PP, et al. The genomic profile of human malignant glioma is altered early in primary cell culture and preserved in spheroids. Oncogene. 2007 - PubMed
Publication types
MeSH terms
LinkOut - more resources
Full Text Sources
Other Literature Sources
Medical
Molecular Biology Databases


