Transcription initiation activity sets replication origin efficiency in mammalian cells - PubMed (original) (raw)
Transcription initiation activity sets replication origin efficiency in mammalian cells
Joana Sequeira-Mendes et al. PLoS Genet. 2009 Apr.
Abstract
Genomic mapping of DNA replication origins (ORIs) in mammals provides a powerful means for understanding the regulatory complexity of our genome. Here we combine a genome-wide approach to identify preferential sites of DNA replication initiation at 0.4% of the mouse genome with detailed molecular analysis at distinct classes of ORIs according to their location relative to the genes. Our study reveals that 85% of the replication initiation sites in mouse embryonic stem (ES) cells are associated with transcriptional units. Nearly half of the identified ORIs map at promoter regions and, interestingly, ORI density strongly correlates with promoter density, reflecting the coordinated organisation of replication and transcription in the mouse genome. Detailed analysis of ORI activity showed that CpG island promoter-ORIs are the most efficient ORIs in ES cells and both ORI specification and firing efficiency are maintained across cell types. Remarkably, the distribution of replication initiation sites at promoter-ORIs exactly parallels that of transcription start sites (TSS), suggesting a co-evolution of the regulatory regions driving replication and transcription. Moreover, we found that promoter-ORIs are significantly enriched in CAGE tags derived from early embryos relative to all promoters. This association implies that transcription initiation early in development sets the probability of ORI activation, unveiling a new hallmark in ORI efficiency regulation in mammalian cells.
Conflict of interest statement
The authors have declared that no competing interests exist.
Figures
Figure 1. Genomic distribution of ORIs in embryonic stem cells.
(A) ORI distribution at different genomic regions along 10.1 Mb of the mouse genome detected by 300–800 nt long nascent strand hybridisation (n = 97) or both by 300–800 nt and 100–600 nt long nascent strands hybridisation (n = 38). (B) Inter-origin distances along 10.1 Mb of the mouse genome (average = 103 kb; n = 97).(C–E) Distribution of ORIs and promoters in gene-rich versus gene-poor regions. ORI location (C), inter-origin distances (D) and density plots (E), of promoter-rich (chromosome 3 and zone 2 of chromosome X) and promoter-poor regions (zone 1 of chromosome X). The genomic features covered by the array, ORI distribution and percentages of ORI occurrence relative to the annotated genes along the 10.1 Mb and per region examined are summarised in Table S1.
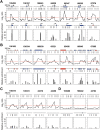
Figure 2. Sensitivity of the ORI identification method.
Array profiles and nascent strand abundance measurements by Q-PCR of 18 positive regions located at 5′ends of genes (A), at less than 200 bp of exons (B), including one at the 3′ UTR of two genes of convergent transcription (ORI 67065), or at intergenic zones (C). Similar analysis was performed for 3 negative regions (D). The maps above each graph show the annotated genomic features and probe distribution of the regions analysed. Blue and red rectangles indicate exons transcribed from the upper or the lower strand, respectively, and black arrows show the position of the major annotated TSS. Grey rectangles represent array probes. The red dashed line depicts the threshold of the array duplicates. Q-PCR experiments were carried out in duplicate in at least two independent preparations of 300–800 nt long nascent strands and values were normalised to the flanking primer pair detecting the lowest amount of nascent strands at each region. Standard deviation bars are indicated. Primer pairs were designed to amplify across the array probes in all possible cases and their sequences are shown in Table S3. ORI 67276 corresponds to the CpG island region of the Mecp2 gene.
Figure 3. Replication initiation activity at CpG island-ORIs.
(A) Array profiles of 9 CpG island-ORIs. Symbols are like in Figure 2.(B) Q-PCR measurements of nascent strands abundance across the positive probes defining the ORIs shown in A in preparations of replication intermediates of the indicated sizes. Primer pairs span less than 2 kb at each region and values were normalised to the average of those obtained at the three negative regions in each gradient fraction. Numbers below each panel indicate fold enrichment of the ORI peak relative to the averaged negative regions. Primer pair sequences are listed in Table S3.
Figure 4. Replication initiation activity at non-promoter-ORIs.
Same analysis as on Figure 3 for 10 non promoter-ORI regions.
Figure 5. ORI specification and firing efficiency across cell types.
Relative abundance of 9 CpG island-ORI regions and 10 non promoter-ORI regions in 300–800 nt long nascent strands derived from ES cells, MEFs and NIH/3T3 fibroblasts. Averaged values for the non-ORI regions were considered as baseline in each cell type.
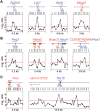
Figure 6. Organisation of replication and transcription initiation at promoter-ORIs.
Maps indicate the number and position of the CAGE tags annotated at CpG island promoter-ORIs with unidirectional (A) and with alternative or bidirectional transcriptional activity (B) . Blue and red arrows indicate transcription from the upper or the lower strand, respectively, and brackets show the position of the CpG islands. Graphs show the nascent strand profiles of the arrays hybridised with 300–800 nt preparations along the same regions. Other symbols are like in Figure 2. (C) Analysis of the TSS and nascent strand profiles at the Flna and Tbx15 loci.
Figure 7. Prediction of novel TSS and association with embryonic transcription.
(A) Enrichment for H3K4me3 and H3K9,14ac modifications relative to total H3 detected by ChIP. Values for the regions flanking Mecp2 and Zad20d1 CpG island-ORIs (ORIs 67276 and 105455, respectively) were considered as baseline. Q-PCR reactions were carried out in duplicate in three independent preparations of immunoprecipitated material. Standard deviation bars are indicated. (B) Expression levels relative to empty vector in transient transfection reporter assays. Constructs carrying the Notch2 and Aprt promoters cloned in the sense orientation were used as positive controls and a region at the first intron of the Notch2 gene cloned in both orientations as the negative one. Histograms represent the averaged normalised values of two independent transfections carried out in duplicate. Standard deviation bars are indicated. Primer pair sequences used and the sizes of the cloned fragments are listed in Table S3. (C) Frequency of promoter-ORIs relative to the number of mapped CAGE tags at each TSS . Grey bars represent ORIs identified by the strict algorithm (n = 40) and white bars ORIs identified when applying a less stringent algorithm (n = 75). (D) Frequency of total promoters or promoter-ORIs transcriptionally active in early development . A chi-square test was used to compare the frequency of tagged promoters between promoter-ORIs identified by the algorithms and the rest of promoters.
Similar articles
- Genome-scale analysis of metazoan replication origins reveals their organization in specific but flexible sites defined by conserved features.
Cayrou C, Coulombe P, Vigneron A, Stanojcic S, Ganier O, Peiffer I, Rivals E, Puy A, Laurent-Chabalier S, Desprat R, Méchali M. Cayrou C, et al. Genome Res. 2011 Sep;21(9):1438-49. doi: 10.1101/gr.121830.111. Epub 2011 Jul 12. Genome Res. 2011. PMID: 21750104 Free PMC article. - Heterochromatin on the inactive X chromosome delays replication timing without affecting origin usage.
Gómez M, Brockdorff N. Gómez M, et al. Proc Natl Acad Sci U S A. 2004 May 4;101(18):6923-8. doi: 10.1073/pnas.0401854101. Epub 2004 Apr 22. Proc Natl Acad Sci U S A. 2004. PMID: 15105447 Free PMC article. - Differences in firing efficiency, chromatin, and transcription underlie the developmental plasticity of the Arabidopsis DNA replication origins.
Sequeira-Mendes J, Vergara Z, Peiró R, Morata J, Aragüez I, Costas C, Mendez-Giraldez R, Casacuberta JM, Bastolla U, Gutierrez C. Sequeira-Mendes J, et al. Genome Res. 2019 May;29(5):784-797. doi: 10.1101/gr.240986.118. Epub 2019 Mar 7. Genome Res. 2019. PMID: 30846531 Free PMC article. - Common structural features of replication origins in all life forms.
Boulikas T. Boulikas T. J Cell Biochem. 1996 Mar 1;60(3):297-316. doi: 10.1002/(sici)1097-4644(19960301)60:3<297::aid-jcb2>3.0.co;2-r. J Cell Biochem. 1996. PMID: 8867806 Review. - CpG islands as genomic footprints of promoters that are associated with replication origins.
Antequera F, Bird A. Antequera F, et al. Curr Biol. 1999 Sep 9;9(17):R661-7. doi: 10.1016/s0960-9822(99)80418-7. Curr Biol. 1999. PMID: 10508580 Review.
Cited by
- Integrative analysis of DNA replication origins and ORC-/MCM-binding sites in human cells reveals a lack of overlap.
Tian M, Wang Z, Su Z, Shibata E, Shibata Y, Dutta A, Zang C. Tian M, et al. Elife. 2024 Apr 3;12:RP89548. doi: 10.7554/eLife.89548. Elife. 2024. PMID: 38567819 Free PMC article. - An emerging paradigm in epigenetic marking: coordination of transcription and replication.
Fenstermaker TK, Petruk S, Mazo A. Fenstermaker TK, et al. Transcription. 2024 Feb-Apr;15(1-2):22-37. doi: 10.1080/21541264.2024.2316965. Epub 2024 Feb 20. Transcription. 2024. PMID: 38378467 Review. - DNA replication and replication stress response in the context of nuclear architecture.
González-Acosta D, Lopes M. González-Acosta D, et al. Chromosoma. 2024 Jan;133(1):57-75. doi: 10.1007/s00412-023-00813-7. Epub 2023 Dec 6. Chromosoma. 2024. PMID: 38055079 Free PMC article. Review. - The genetic landscape of origins of replication in P. falciparum.
Castellano CM, Lacroix L, Mathis E, Prorok P, Hennion M, Lopez-Rubio JJ, Méchali M, Gomes AR. Castellano CM, et al. Nucleic Acids Res. 2024 Jan 25;52(2):660-676. doi: 10.1093/nar/gkad1103. Nucleic Acids Res. 2024. PMID: 38038269 Free PMC article. - Dimeric G-quadruplex motifs-induced NFRs determine strong replication origins in vertebrates.
Poulet-Benedetti J, Tonnerre-Doncarli C, Valton AL, Laurent M, Gérard M, Barinova N, Parisis N, Massip F, Picard F, Prioleau MN. Poulet-Benedetti J, et al. Nat Commun. 2023 Aug 10;14(1):4843. doi: 10.1038/s41467-023-40441-4. Nat Commun. 2023. PMID: 37563125 Free PMC article.
References
- Arias EE, Walter JC. Strength in numbers: preventing rereplication via multiple mechanisms in eukaryotic cells. Genes Dev. 2007;21:497–518. - PubMed
- Diffley JF. Regulation of early events in chromosome replication. Curr Biol. 2004;14:R778–786. - PubMed
- Tabancay AP, Jr, Forsburg SL. Eukaryotic DNA replication in a chromatin context. Curr Top Dev Biol. 2006;76:129–184. - PubMed
Publication types
MeSH terms
LinkOut - more resources
Full Text Sources
Other Literature Sources


