Statistical methods for detecting differentially abundant features in clinical metagenomic samples - PubMed (original) (raw)
Statistical methods for detecting differentially abundant features in clinical metagenomic samples
James Robert White et al. PLoS Comput Biol. 2009 Apr.
Abstract
Numerous studies are currently underway to characterize the microbial communities inhabiting our world. These studies aim to dramatically expand our understanding of the microbial biosphere and, more importantly, hope to reveal the secrets of the complex symbiotic relationship between us and our commensal bacterial microflora. An important prerequisite for such discoveries are computational tools that are able to rapidly and accurately compare large datasets generated from complex bacterial communities to identify features that distinguish them.We present a statistical method for comparing clinical metagenomic samples from two treatment populations on the basis of count data (e.g. as obtained through sequencing) to detect differentially abundant features. Our method, Metastats, employs the false discovery rate to improve specificity in high-complexity environments, and separately handles sparsely-sampled features using Fisher's exact test. Under a variety of simulations, we show that Metastats performs well compared to previously used methods, and significantly outperforms other methods for features with sparse counts. We demonstrate the utility of our method on several datasets including a 16S rRNA survey of obese and lean human gut microbiomes, COG functional profiles of infant and mature gut microbiomes, and bacterial and viral metabolic subsystem data inferred from random sequencing of 85 metagenomes. The application of our method to the obesity dataset reveals differences between obese and lean subjects not reported in the original study. For the COG and subsystem datasets, we provide the first statistically rigorous assessment of the differences between these populations. The methods described in this paper are the first to address clinical metagenomic datasets comprising samples from multiple subjects. Our methods are robust across datasets of varied complexity and sampling level. While designed for metagenomic applications, our software can also be applied to digital gene expression studies (e.g. SAGE). A web server implementation of our methods and freely available source code can be found at http://metastats.cbcb.umd.edu/.
Conflict of interest statement
The authors have declared that no competing interests exist.
Figures
Figure 1. Format of the feature abundance matrix.
Each row represents a specific taxon, while each column represents a subject or replicate. The frequency of the i th feature in the j th subject (c(i,j)) is recorded in the corresponding cell of the matrix. If there are g subjects in the first population, they are represented by the first g columns of the matrix, while the remaining columns represent subjects from the second population.
Figure 2. Detecting differential abundance for sparse features.
A 2×2 contingency table is used in Fisher's exact test for differential abundance between rare features. f11 is the number of observations of feature i in all individuals from treatment 1. f21 is the number of observations that are not feature i in all individuals from treatment 1. f12 and f22 are similarly defined for treatment 2.
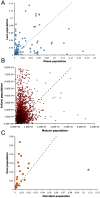
Figure 3. Dispersion estimates (φ) for three metagenomic datasets used in this study.
These plots compare dispersion values between (A) obese and lean human gut taxonomic data, (B) infant and mature human gut COG assignments, and (C) microbial and viral subsystem annotations. We find a wide range of possible dispersions in this data and significant differences in dispersions between two populations.
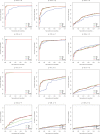
Figure 4. ROC curves comparing statistical methods in a simulation study.
Sequences were selected from a beta-binomial distribution with variable dispersions and group mean proportions p1 and p2. For each set of parameters, we simulated 1000 trials, 500 of which are generated under the null hypothesis (p1 = p2), and the remainder are differentially abundant where a*p1 = p2. For example, p = 0.2 and a = 2 indicates features comprising 20% of the population that differ two-fold in abundance between two populations of interest. Parameter values for p1 and a are shown above each plot.
Figure 5. ROC curves comparing statistical methods in a simulation study for extreme sparse sampling.
Sequences were selected from a beta-binomial distribution with variable dispersions and group mean proportions p1 and p2. For each set of parameters, we simulated 1000 trials, 500 of which are generated under the null hypothesis (p1 = p2), and the remainder are differentially abundant where a*p1 = p2. For example, p = 0.2 and a = 2 indicates features comprising 20% of the population that differ two-fold in abundance between two populations of interest. Parameter values for p1 and a are shown above each plot.
Similar articles
- MetaPath: identifying differentially abundant metabolic pathways in metagenomic datasets.
Liu B, Pop M. Liu B, et al. BMC Proc. 2011 May 28;5 Suppl 2(Suppl 2):S9. doi: 10.1186/1753-6561-5-S2-S9. BMC Proc. 2011. PMID: 21554767 Free PMC article. - MetaRank: a rank conversion scheme for comparative analysis of microbial community compositions.
Wang TY, Su CH, Tsai HK. Wang TY, et al. Bioinformatics. 2011 Dec 15;27(24):3341-7. doi: 10.1093/bioinformatics/btr583. Epub 2011 Oct 20. Bioinformatics. 2011. PMID: 22016405 - An informative approach on differential abundance analysis for time-course metagenomic sequencing data.
Luo D, Ziebell S, An L. Luo D, et al. Bioinformatics. 2017 May 1;33(9):1286-1292. doi: 10.1093/bioinformatics/btw828. Bioinformatics. 2017. PMID: 28057680 - Application of computational approaches to analyze metagenomic data.
Gwak HJ, Lee SJ, Rho M. Gwak HJ, et al. J Microbiol. 2021 Mar;59(3):233-241. doi: 10.1007/s12275-021-0632-8. Epub 2021 Feb 10. J Microbiol. 2021. PMID: 33565054 Review. - The core gut microbiome, energy balance and obesity.
Turnbaugh PJ, Gordon JI. Turnbaugh PJ, et al. J Physiol. 2009 Sep 1;587(Pt 17):4153-8. doi: 10.1113/jphysiol.2009.174136. Epub 2009 Jun 2. J Physiol. 2009. PMID: 19491241 Free PMC article. Review.
Cited by
- Dietary supplementation of ferrous glycinate improves intestinal barrier function by modulating microbiota composition in Cherry Valley ducks.
Yu H, Xie Y, Wu B, Zhao H, Chen X, Tian G, Liu G, Cai J, Jia G. Yu H, et al. Anim Nutr. 2022 Aug 8;11:264-275. doi: 10.1016/j.aninu.2022.07.007. eCollection 2022 Dec. Anim Nutr. 2022. PMID: 36263405 Free PMC article. - Alterations of the Mucosal Immune Response and Microbial Community of the Skin upon Viral Infection in Rainbow Trout (Oncorhynchus mykiss).
Zhan M, Huang Z, Cheng G, Yu Y, Su J, Xu Z. Zhan M, et al. Int J Mol Sci. 2022 Nov 14;23(22):14037. doi: 10.3390/ijms232214037. Int J Mol Sci. 2022. PMID: 36430516 Free PMC article. - Comparative analysis of the intestinal bacterial and RNA viral communities from sentinel birds placed on selected broiler chicken farms.
Day JM, Oakley BB, Seal BS, Zsak L. Day JM, et al. PLoS One. 2015 Jan 30;10(1):e0117210. doi: 10.1371/journal.pone.0117210. eCollection 2015. PLoS One. 2015. PMID: 25635690 Free PMC article. - Intestinal Dysbiosis in Young Cystic Fibrosis Rabbits.
Liang X, Bouhamdan M, Hou X, Zhang K, Song J, Hao K, Jin JP, Zhang Z, Xu J. Liang X, et al. J Pers Med. 2021 Feb 16;11(2):132. doi: 10.3390/jpm11020132. J Pers Med. 2021. PMID: 33669429 Free PMC article. - Effects of the DMRT1 genotype on the body weight and gut microbiota in the broiler chicken.
Ji J, Xu Y, Luo C, He Y, Xu X, Yan X, Li Y, Shu D, Qu H. Ji J, et al. Poult Sci. 2020 Aug;99(8):4044-4051. doi: 10.1016/j.psj.2020.03.055. Epub 2020 May 4. Poult Sci. 2020. PMID: 32731992 Free PMC article.
References
Publication types
MeSH terms
Substances
LinkOut - more resources
Full Text Sources
Other Literature Sources
Medical


