Specific and slow inhibition of the kir2.1 K+ channel by gambogic acid - PubMed (original) (raw)
Specific and slow inhibition of the kir2.1 K+ channel by gambogic acid
Elena Zaks-Makhina et al. J Biol Chem. 2009.
Abstract
Although Kir2.1 channels are important in the heart and other excitable cells, there are virtually no specific drugs for this K+ channel. In search of Kir2.1 modulators, we screened a library of 720 naturally occurring compounds using a yeast strain in which mammalian Kir2.1 enables growth at low [K+]. One of the identified compounds, gambogic acid (GA), potently (EC(50) < or = 100 nm) inhibited Kir2.1 channels in mammalian cells when applied chronically for 3 h. This potent and slow inhibition was not seen with Kv2.1, HERG or Kir1.1 channels. However, acutely applied GA acted as a weak (EC(50) = approximately 10 mum) non-selective K+ channel blocker. Intracellular delivery of GA via a patch pipette did not potentiate the acute effect of GA on Kir2.1, showing that slow uptake is not responsible for the delayed, potent effect. Immunoblots showed that total Kir2.1 protein expression was not altered by GA. Similarly, immunostaining of intact cells expressing Kir2.1 with an extracellular epitope tag demonstrated that GA does not affect Kir2.1 surface expression. However, the 3-h treatment with GA caused redistribution of Kir2.1 and Kv2.1 from the Triton X-100-insoluble to the Triton X-100-soluble membrane fraction. Thus, GA changes the K+ channel membrane microenvironment resulting in potent, specific, and slow acting inhibition of Kir2.1 channels.
Figures
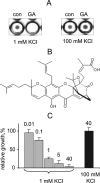
FIGURE 1.
Identification of GA as a Kir2.1 channel inhibitor in yeast. A, HTS of the Natural Products library. Kir2.1-expressing yeast was grown in 96-well plates in the presence of test compounds at 40 μ
m
or vehicle for 24 h. GA inhibits yeast growth in media with 1 m
m
KCl, but not 100 m
m
KCl. B, structural formula of GA. C, concentration-dependence of GA inhibition of yeast growth. Yeast was grown in 96-well plates with GA at indicated concentrations (μ
m
) or vehicle in media with 1 m
m
and 100 m
m
KCl. Bars represent average _A_600 of cultures in 10 independent wells ± S.E. normalized to control.
FIGURE 2.
GA inhibition of Kir2.1 current in HEK293 cells. A, time course of 86Rb+ efflux from cells treated with GA at indicated concentrations (μ
m
) for 3 h. B, Kir2.1 currents evoked by voltage-clamp ramps from −120 mV to 0 mV from holding potential of −40 mV in nontreated cells and in cells treated with 50 n
m
or 500 n
m
GA for 3 h. Data represent mean ± S.E., n = 6–10. C, Kir2.1 currents evoked by voltage clamp ramps from −120 mV to 0 mV from holding potential of −40 mV before and after acute application of 10 μ
m
GA. Data represent mean ± S.E., n = 3. D, dose-response relationship for acute and chronic GA inhibition. Inward current was measured at −117 mV. Data points represent mean ± S.E. The number of cells for each data point is indicated in parentheses.
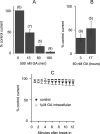
FIGURE 3.
Time dependence of GA inhibition of Kir2.1 current. A, maximal inward current at −117 mV from holding potential of −40 mV after exposure to 0.5 μ
m
GA for 0–180 min, normalized to control. Data points represent mean ± S.E., n is indicated in parentheses. B, residual Kir2.1 current after 3 and 17 h of exposure to 50 n
m
GA normalized to control. Data represent mean ± S.E., n indicated in parentheses. C, amplitude of the inward current measured at −117 mV as a function of time after break-in for cells dialyzed with 1 μ
m
GA, n = 3–5.
FIGURE 4.
GA inhibition of Kv2.1 current. A, representative currents evoked by depolarization steps from holding potential of −70 mV in 10-mV increments in CHO cells transiently expressing Kv2.1 channel before and after acute application of 10 μ
m
GA. B, dose-response relationship for acute GA inhibition. Kv2.1 currents were measured at +50 mV, n for each data point is indicated in parentheses. C, conductance-voltage relationships of Kv2.1 currents before and during acute application of 10 μ
m
GA. Data represent mean ± S.E., n = 5. D, density of Kv2.1 currents versus membrane potential in control cells (n = 4) and cells treated with 0.5 μ
m
GA for 3 h (n = 5).
FIGURE 5.
GA does not affect HERG and Kir1.1 channels. A, time course of 86Rb+ efflux from HEK293 cells stably expressing HERG channel. Cells were incubated with GA at indicated concentrations (μ
m
) for 2 h. 86Rb+ efflux was induced by 50 m
m
KCl and repressed by 10 μ
m
E-4031. Baseline efflux was measured at external KCl of 5 m
m
. B, relative amount of released 86Rb+ in 3 min via HERG channel. Control cells were not treated with GA. Numbers indicate GA and E-4031 concentrations in μ
m
. Bars represent mean ± S.E., n = 3–5. C, time course of 86Rb+ efflux from HEK293 cells with Tet-inducible Kir1.1 channels. Cells were incubated with GA at indicated concentrations (μ
m
) for 2 h. D, relative amount of released 86Rb+ in 3 min via Kir1.1 channel. Numbers indicate GA concentrations in μ
m
. Bars represent mean ± S.E., n = 3–5.
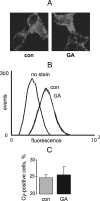
FIGURE 6.
GA does not affect Kir2.1 channel surface expression in HEK cells. A, live cells stably expressing Kir2.1 channel with extracellular HA epitope were stained with anti-HA Cy-2 conjugated antibody following treatment with 1 μ
m
GA or vehicle for 3 h. B, flow cytometry analysis of HEK cells treated with GA and stained as in A. C, quantification of B, n = 4.
FIGURE 7.
GA changes Kir2.1 and Kv2.1 solubility in Triton X-100. A and B, HEK cells stably expressing Kir2.1-HA and HEK cells transiently expressing Kv2.1-Myc were incubated with 1 μ
m
GA for 3 h. Total membrane fractions from GA-exposed and control cells were solubilized in cold 1% TX100 for 15 min and separated by centrifugation. Channel protein in total, TX100-soluble and TX-insoluble membrane fractions were analyzed by anti-HA and anti-Myc immunoblotting.
Similar articles
- Inhibition of inwardly rectifying Kir2.x channels by the novel anti-cancer agent gambogic acid depends on both pore block and PIP2 interference.
Scherer D, Schworm B, Seyler C, Xynogalos P, Scholz EP, Thomas D, Katus HA, Zitron E. Scherer D, et al. Naunyn Schmiedebergs Arch Pharmacol. 2017 Jul;390(7):701-710. doi: 10.1007/s00210-017-1372-5. Epub 2017 Apr 2. Naunyn Schmiedebergs Arch Pharmacol. 2017. PMID: 28365825 - Cholesterol sensitivity and lipid raft targeting of Kir2.1 channels.
Romanenko VG, Fang Y, Byfield F, Travis AJ, Vandenberg CA, Rothblat GH, Levitan I. Romanenko VG, et al. Biophys J. 2004 Dec;87(6):3850-61. doi: 10.1529/biophysj.104.043273. Epub 2004 Oct 1. Biophys J. 2004. PMID: 15465867 Free PMC article. - Tamoxifen inhibits inward rectifier K+ 2.x family of inward rectifier channels by interfering with phosphatidylinositol 4,5-bisphosphate-channel interactions.
Ponce-Balbuena D, López-Izquierdo A, Ferrer T, Rodríguez-Menchaca AA, Aréchiga-Figueroa IA, Sánchez-Chapula JA. Ponce-Balbuena D, et al. J Pharmacol Exp Ther. 2009 Nov;331(2):563-73. doi: 10.1124/jpet.109.156075. Epub 2009 Aug 4. J Pharmacol Exp Ther. 2009. PMID: 19654266 - Molecular characterization of an inward rectifier channel (IKir) found in avian vestibular hair cells: cloning and expression of pKir2.1.
Correia MJ, Wood TG, Prusak D, Weng T, Rennie KJ, Wang HQ. Correia MJ, et al. Physiol Genomics. 2004 Oct 4;19(2):155-69. doi: 10.1152/physiolgenomics.00096.2004. Epub 2004 Aug 17. Physiol Genomics. 2004. PMID: 15316115 - Physiological role of inward rectifier K(+) channels in vascular smooth muscle cells.
Park WS, Han J, Earm YE. Park WS, et al. Pflugers Arch. 2008 Oct;457(1):137-47. doi: 10.1007/s00424-008-0512-7. Epub 2008 Apr 25. Pflugers Arch. 2008. PMID: 18437413 Review.
Cited by
- The network of cardiac KIR2.1: its function, cellular regulation, electrical signaling, diseases and new drug avenues.
Li E, van der Heyden MAG. Li E, et al. Naunyn Schmiedebergs Arch Pharmacol. 2024 Sep;397(9):6369-6389. doi: 10.1007/s00210-024-03116-5. Epub 2024 Apr 29. Naunyn Schmiedebergs Arch Pharmacol. 2024. PMID: 38683369 Free PMC article. Review. - Kir Channel Molecular Physiology, Pharmacology, and Therapeutic Implications.
Cui M, Cantwell L, Zorn A, Logothetis DE. Cui M, et al. Handb Exp Pharmacol. 2021;267:277-356. doi: 10.1007/164_2021_501. Handb Exp Pharmacol. 2021. PMID: 34345939 Review. - Inhibition of inwardly rectifying Kir2.x channels by the novel anti-cancer agent gambogic acid depends on both pore block and PIP2 interference.
Scherer D, Schworm B, Seyler C, Xynogalos P, Scholz EP, Thomas D, Katus HA, Zitron E. Scherer D, et al. Naunyn Schmiedebergs Arch Pharmacol. 2017 Jul;390(7):701-710. doi: 10.1007/s00210-017-1372-5. Epub 2017 Apr 2. Naunyn Schmiedebergs Arch Pharmacol. 2017. PMID: 28365825 - Challenges and innovation: Disease modeling using human-induced pluripotent stem cell-derived cardiomyocytes.
Reilly L, Munawar S, Zhang J, Crone WC, Eckhardt LL. Reilly L, et al. Front Cardiovasc Med. 2022 Aug 12;9:966094. doi: 10.3389/fcvm.2022.966094. eCollection 2022. Front Cardiovasc Med. 2022. PMID: 36035948 Free PMC article. Review. - Styrax blocks inward and outward current of Kir2.1 channel.
Ren S, Pang C, Li J, Huang Y, Zhang S, Zhan Y, An H. Ren S, et al. Channels (Austin). 2017 Jan 2;11(1):46-54. doi: 10.1080/19336950.2016.1207022. Epub 2016 Aug 12. Channels (Austin). 2017. PMID: 27540685 Free PMC article.
References
- Plaster N. M., Tawil R., Tristani-Firouzi M., Canún S., Bendahhou S., Tsunoda A., Donaldson M. R., Iannaccone S. T., Brunt E., Barohn R., Clark J., Deymeer F., George A. L., Jr., Fish F. A., Hahn A., Nitu A., Ozdemir C., Serdaroglu P., Subramony S. H., Wolfe G., Fu Y. H., Ptácek L. J. ( 2001) Cell 105, 511– 519 - PubMed
- Priori S. G., Pandit S. V., Rivolta I., Berenfeld O., Ronchetti E., Dhamoon A., Napolitano C., Anumonwo J., di Barletta M. R., Gudapakkam S., Bosi G., Stramba-Badiale M., Jalife J. ( 2005) Circ. Res. 96, 800– 807 - PubMed
- Matsuda H., Saigusa A., Irisawa H. ( 1987) Nature 325, 156– 159 - PubMed
- Lopatin A. N., Makhina E. N., Nichols C. G. ( 1994) Nature 372, 366– 369 - PubMed
- Fakler B., Brändle U., Glowatzki E., Weidemann S., Zenner H. P., Ruppersberg J. P. ( 1995) Cell 80, 149– 154 - PubMed
Publication types
MeSH terms
Substances
LinkOut - more resources
Full Text Sources


