Bmi1 lineage tracing identifies a self-renewing pancreatic acinar cell subpopulation capable of maintaining pancreatic organ homeostasis - PubMed (original) (raw)
Bmi1 lineage tracing identifies a self-renewing pancreatic acinar cell subpopulation capable of maintaining pancreatic organ homeostasis
Eugenio Sangiorgi et al. Proc Natl Acad Sci U S A. 2009.
Abstract
A central question in stem cell biology is whether organ homeostasis is maintained in adult organs through undifferentiated stem cells or self-duplication of specialized cell populations. To address this issue in the exocrine pancreas we analyzed the Bmi1-labeled cell lineage of pancreatic acinar cells. Previously, we had shown that inducible linage tracing with Bmi1-Cre-estrogen receptor (ER) in the small intestine specifically, labels "classical" undifferentiated intestinal stem cells. In this article we demonstrate that the Bmi1-Cre-ER system labels a subpopulation of differentiated acinar cells in the exocrine pancreas whose derivatives are still present, at a steady-state level, 1 year after a single TM pulse. This study suggests that Bmi1 is a marker for a subpopulation of self-renewing acinar cells, indicating that self-renewal is not an exclusive feature of adult undifferentiated stem cells. Further, the extended period that Bmi1-labeled acinar cells retain a pulse of BrdU suggests that some of this subpopulation of cells are not continuously replicating, but rather are set aside until needed. This cellular behavior is again reminiscent of behavior normally associated with more classical adult stem cells. Setting aside cells capable of self-renewal until needed retains the advantage of protecting this subpopulation of cells from DNA damage induced during replication.
Conflict of interest statement
The authors declare no conflict of interest.
Figures
Fig. 1.
Bmi1 lineage analysis in pancreas. (A) More than 70 _Bmi1_Cre-ER/+;_Rosa26_YFP/+ mice (or _Rosa26_LacZ/+) were generated, injected at weaning with TM, and harvested at different time points from 21 h up to 1 year. (B) Whole-mount LacZ staining showing the pattern of the lineage obtained 5 days after TM treatment. (C) Age-matched control _Bmi1_Cre-ER/+;_Rosa26_LacZ/+ pancreas without TM showed no activation of the LacZ reporter. (D and E) Pancreatic sections showing the Bmi1+ lineage. (E) High magnification of an YFP+ differentiated acinar cell. (Scale bars: 50 μm.)
Fig. 2.
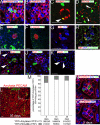
Early Bmi1+ lineage is present only in differentiated cells. (A–D) Bmi1 is expressed in acinar cells (amylase+), glucagon+ cells (white arrowhead), and endothelial cells (PECAM+) (white arrowheads). (E–I) Bmi1 is largely absent from other cells in the islets (ChromograninA+ and C-peptide+), ducts (DBA+), and centroacinar cells (Sox9+) (white arrowheads). In A, B, G, and H E-cadherin staining was used to identify the cell boundaries. (J–K) Bmi1+ lineage is negative for Pdx1 and Nestin (white arrowheads). (L) Representative microscopic field of our analysis, the higher magnification inset shows an endothelial cell (PECAM+) and some acinar cells (amylase+). (M) At 5, 15, and 30 days pancreas was harvested from _Bmi1_Cre-ER/+;_Rosa26_FP/+ mice. All differentiated double positive cells were counted for each time point. (N and O) Representative pictures of 2 of the 100 cells analyzed at 5 days after TM treatment to show the perfect colocalization between YFP+ cell and amylase. E-cadherin staining was used to identify the cell boundaries. (Scale bars: 50 μm.)
Fig. 3.
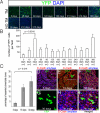
Bmi1 long-term lineage analysis. (A and B) _Bmi1_Cre-ER/+;_Rosa26_YFP/+ mice were injected at weaning with TM and followed for >1 year. (A) Representative microscopic fields of pancreas harvested at different time points showing YFP+ cells. Control pancreas with the same genotype without TM, showing no YFP+ cells. (B) Graph showing the number of YFP+ cells present at the different time points analyzed. (C) Graph showing the percentage of clones at 5, 15, and 30 days that underwent replication. YFP+ cells with 1 or more labeled adjacent cells (expanded clones) increased over time. (D–I) Representative pictures of mostly isolated cells at 5 days (D) and expanded clones at 15 and 30 days (E–I). (Insets) High-magnification images of an isolated cell (D) and 3 YFP+ adjacent cells (E). (Scale bars: 50 μm.)
Fig. 4.
Proliferation analysis of the Bmi1 lineage. (A) Amylase+ cells are Ki-67+ indicating proliferation potential. (B and C) Bmi1 lineage is also Ki-67+. (D–I) Short-term analysis of BrdU incorporation. (D) Schematic representation of the BrdU and the TM treatment. (E) Percentage of YFP+BrdU+ cells at 15, 30, and 120 days. (F) The Bmi1+ lineage in mice fed with BrdU was reduced, with respect to mice never treated with BrdU, at 15 and 30 days, but was comparable at 120 days. (G–I) Representative microscopic fields showing YFP+BrdU+ (white arrowhead), amylase+BrdU+, and amylase+YFP+BrdU+ cells (white arrowhead). (J–N) Long-term BrdU chase to show the persistence of the BrdU lineage. (J) Schematic representation of the whole experiment. (K) Percentage of YFP+BrdU+ cells at 7 months. (L) Comparison of the lineage at 1 and 7 months after 1 TM injection at weaning and at 7 months after 1 injection at 6 months (with and without BrdU). (M and N) Representative pictures of YFP+BrdU+ and amylase+YFP+BrdU+(white arrowhead) cells indicating that those cells were differentiated. (O–Q) BrdU treatment at 8 months after TM treatment. (O) Schematic representation of the TM and BrdU treatments. (P) Percentage of YFP+BrdU+ cells at 9 months. (Q) Representative pancreatic section showing 4 YFP+BrdU+ cells. (Scale bars: 25 μm.)
Fig. 5.
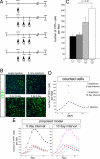
Evaluation of the Bmi1 lineage after different TM treatments. (A) Schematic representation of a single treatment, 3 consecutive injections, and 3 injections spaced every 5 or 10 days. All _Bmi1_Cre-ER/+;_Rosa26_YFP/+ mice were analyzed 30 days after the first injection. (B and C) Representative pictures and quantitative analysis of pancreatic sections after different treatments. (D) Different representation of counted cells. The continuous curve represents the number of cells present at different days after 1 TM injection. This curve was interpolated by using the cells counted at 5, 15, 30, and 60 days, assuming a constant increase in the number of cells. The black and pink triangles represent the mean of the YFP+ cells counted after 3 injections at 5-day intervals and 3 injections at 10-day intervals. (E) Proposed model showing that if each TM injection activates the same number of cells (blue, red, and green lines) after 30 days the number of expected labeled cells matches the number of obtained cells. The black and pink lines indicate at each day the expected sum of all of the cells present in the pancreas as a result of the 3 different waves. (Scale bars: 100 μm.)
Fig. 6.
Bmi1 lineage ablation. (A) _Bmi1_Cre-ER/+;_Rosa26_DTA/+ mice were injected 3 times every 5 days before harvesting pancreas 5 and 12 days after last injection. (B) After 5 days there were many cells in mitosis. Amylase+Ki-67+ cells were counted, compared at 5 and 12 days after injection, and compared with wild-type age-matched control pancreas. (C–H) Representative pictures at low and high magnification showing Ki-67+ cells actively dividing. E and F are low and high magnification, respectively, of amylase+Ki-67+ cells. It was common to observe chromosomes in metaphase (G and H)(red arrowheads). (I–L) Bmi1 lineage after mild pancreatitis. (I) Schematic diagram showing the caerulein treatment followed by TM administration in _Bmi1_Cre-ER/+;_Rosa26_YFP/+ mice. (J–L) The Bmi1 lineage was increased compared with the lineage without caerulein treatment. (J and K) Representative pictures at 5 days after TM without and with caerulein. (M–O) Representative pictures showing that after caerulein treatment the Bmi1 lineage is present only in differentiated cells. (Scale bars: 50 μm.)
Similar articles
- Bmi1 is required for regeneration of the exocrine pancreas in mice.
Fukuda A, Morris JP 4th, Hebrok M. Fukuda A, et al. Gastroenterology. 2012 Sep;143(3):821-831.e2. doi: 10.1053/j.gastro.2012.05.009. Epub 2012 May 17. Gastroenterology. 2012. PMID: 22609312 Free PMC article. - Bmi1 is expressed in vivo in intestinal stem cells.
Sangiorgi E, Capecchi MR. Sangiorgi E, et al. Nat Genet. 2008 Jul;40(7):915-20. doi: 10.1038/ng.165. Epub 2008 Jun 8. Nat Genet. 2008. PMID: 18536716 Free PMC article. - The epigenetic regulators Bmi1 and Ring1B are differentially regulated in pancreatitis and pancreatic ductal adenocarcinoma.
Martínez-Romero C, Rooman I, Skoudy A, Guerra C, Molero X, González A, Iglesias M, Lobato T, Bosch A, Barbacid M, Real FX, Hernández-Muñoz I. Martínez-Romero C, et al. J Pathol. 2009 Oct;219(2):205-13. doi: 10.1002/path.2585. J Pathol. 2009. PMID: 19585519 - Bmi1 in development and tumorigenesis of the central nervous system.
Shakhova O, Leung C, Marino S. Shakhova O, et al. J Mol Med (Berl). 2005 Aug;83(8):596-600. doi: 10.1007/s00109-005-0682-0. Epub 2005 Jun 23. J Mol Med (Berl). 2005. PMID: 15976916 Review. - Role of BMI1, a stem cell factor, in cancer recurrence and chemoresistance: preclinical and clinical evidences.
Siddique HR, Saleem M. Siddique HR, et al. Stem Cells. 2012 Mar;30(3):372-8. doi: 10.1002/stem.1035. Stem Cells. 2012. PMID: 22252887 Review.
Cited by
- Therapeutic use of human renal progenitor cells for kidney regeneration.
Bussolati B, Camussi G. Bussolati B, et al. Nat Rev Nephrol. 2015 Dec;11(12):695-706. doi: 10.1038/nrneph.2015.126. Epub 2015 Aug 4. Nat Rev Nephrol. 2015. PMID: 26241019 Review. - Inflammation increases cells expressing ZSCAN4 and progenitor cell markers in the adult pancreas.
Ko SB, Azuma S, Yokoyama Y, Yamamoto A, Kyokane K, Niida S, Ishiguro H, Ko MS. Ko SB, et al. Am J Physiol Gastrointest Liver Physiol. 2013 Jun 15;304(12):G1103-16. doi: 10.1152/ajpgi.00299.2012. Epub 2013 Apr 18. Am J Physiol Gastrointest Liver Physiol. 2013. PMID: 23599043 Free PMC article. - Adult Pancreatic Acinar Progenitor-like Populations in Regeneration and Cancer.
Jiang Z, White RA, Wang TC. Jiang Z, et al. Trends Mol Med. 2020 Aug;26(8):758-767. doi: 10.1016/j.molmed.2020.04.003. Epub 2020 Apr 30. Trends Mol Med. 2020. PMID: 32362534 Free PMC article. Review. - BMI1 represses Ink4a/Arf and Hox genes to regulate stem cells in the rodent incisor.
Biehs B, Hu JK, Strauli NB, Sangiorgi E, Jung H, Heber RP, Ho S, Goodwin AF, Dasen JS, Capecchi MR, Klein OD. Biehs B, et al. Nat Cell Biol. 2013 Jul;15(7):846-52. doi: 10.1038/ncb2766. Epub 2013 Jun 2. Nat Cell Biol. 2013. PMID: 23728424 Free PMC article. - Krüppel-like Factor 4 Modulates Development of BMI1(+) Intestinal Stem Cell-Derived Lineage Following γ-Radiation-Induced Gut Injury in Mice.
Kuruvilla JG, Kim CK, Ghaleb AM, Bialkowska AB, Kuo CJ, Yang VW. Kuruvilla JG, et al. Stem Cell Reports. 2016 Jun 14;6(6):815-824. doi: 10.1016/j.stemcr.2016.04.014. Epub 2016 May 26. Stem Cell Reports. 2016. PMID: 27237377 Free PMC article.
References
- Rusch HP. Carcinogenesis: A facet of living processes. Cancer Res. 1954;14:407–417. - PubMed
- Leblond CP. Classification of cell populations on the basis of their proliferative behavior. Natl Cancer Inst Monogr. 1964;14:119–150. - PubMed
- Fitzgerald PJ, Carol BM, Lawrence R. Pancreatic acinar cell regeneration. Nature. 1966;212:594–596. - PubMed
- Teta M, Rankin MM, Long SY, Stein GM, Kushner JA. Growth and regeneration of adult β cells does not involve specialized progenitors. Dev Cell. 2007;12:817–826. - PubMed
- Dor Y, Brown J, Martinez OI, Melton DA. Adult pancreatic β cells are formed by self-duplication rather than stem-cell differentiation. Nature. 2004;429:41–46. - PubMed
Publication types
MeSH terms
Substances
LinkOut - more resources
Full Text Sources
Other Literature Sources
Molecular Biology Databases


