DoG Picker and TiltPicker: software tools to facilitate particle selection in single particle electron microscopy - PubMed (original) (raw)
DoG Picker and TiltPicker: software tools to facilitate particle selection in single particle electron microscopy
N R Voss et al. J Struct Biol. 2009 May.
Abstract
Solving the structure of macromolecular complexes using transmission electron microscopy can be an arduous task. Many of the steps in this process rely strongly on the aid of pre-existing structural knowledge, and are greatly complicated when this information is unavailable. Here, we present two software tools meant to facilitate particle picking, an early stage in the single-particle processing of unknown macromolecules. The first tool, DoG Picker, is an efficient and reasonably general, particle picker based on the Difference of Gaussians (DoG) image transform. It can function alone, as a reference-free particle picker with the unique ability to sort particles based on size, or it can also be used as a way to bootstrap the creation of templates or training datasets for other particle pickers. The second tool is TiltPicker, an interactive graphical interface application designed to streamline the selection of particle pairs from tilted-pair datasets. In many respects, TiltPicker is a re-implementation of the SPIDER WEB tilted-particle picker, but built on modern computer frameworks making it easier to deploy and maintain. The TiltPicker program also includes several useful new features beyond those of its predecessor.
Figures
Figure 1
Shape of the DoG function. (A) Real space shape of the DoG functions for difference sigma values (B) The Fourier transform of the same DoG functions shown in panel A. Note how the DoG filter acts as a band-pass filter.
Figure 2
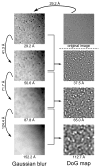
Example of the DoG picker technique for picking particles of different sizes. The original image of GroEL particles (upper right) is first blurred by a sigma of 29.2Å (upper left). Next the image is successively blurred three more times by the values at the far left to get final images blurred by the amount below the image (left column). Each successive image pair is then subtracted to get the DoG filtered map (right column) highlighting the particles of a different size for each DoG map. This example then picks particles of size 37.5Å, 65.0Å, and 112.7Å.
Figure 3
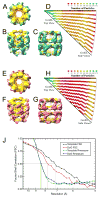
Three dimensional structures of GroEL resulting from particles picked using DoG picker (A-D, blue) and template correlation (E-H, pink). For both GroEL reconstructions there are top (A and E), intermediate (B and F) and side (C and G) views of the final structure. In addition, Euler angle distributions (D and H) display a histogram of the number of particles in a certain projection of the particle. The number of particles is represented by color, with green representing a high population and red a low population. (J) The even-odd FSC and Rmeasure resolution plots for the GroEL structures from DoG picker and template correlation. DoG Picker resulted in maps with resolutions of FSC½ at 7.75Å and Rmeasure at 8.40Å. Template correlation resulted in resolutions of FSC½ at 7.16Å and Rmeasure at 8.45Å.
Figure 4
Three dimensional structures of chloroplast ribosome resulting from particles picked using DoG picker (A, blue) and template correlation (B, pink). (A) Stereo view of the chloroplast ribosome structure from the DoG picked particles. (B) Stereo view of the chloroplast ribosome structure from particles picked by template correlation. (C) The even-odd FSC and Rmeasure resolution plots for the chloroplast ribosome structures from DoG picker and template correlation. DoG picker resulted in maps with resolutions of FSC½ at 13.6Å and Rmeasure at 17.1Å. Template correlation resulted in resolutions of FSC½ at 13.7Å and Rmeasure at 17.9Å.
Figure 5
Transformation operations for aligning image coordinate systems between an untilted and a tilted image. The original untilted image (image #1) is transformed into a tilted image by three operations (top row, from left to right). First, the original untilted image (image #1) is rotated counter-clockwise by its tilt axis angle (see image #2). Second, the rotated image (image #2) is compressed along the tilt axis, which is now vertical to the page (see image #3). Finally, the compressed image (image #3) is rotated clockwise by the tilt axis (see image #4). The reverse operation is used to transform the tilted image into the untilted image (bottom row, from right to left). The original tilted image (image #8) is rotated counter-clockwise (see image #7), expanded (see image #6), and then rotated back clockwise (see image #5). Each pair of images in a column have the same coordinate systems, but were transformed from different images. The red lines in images #5 and #4 show the overlapping region of the image when compared to images #1 and #8, respectively.
Figure 6
The interactive TiltPicker display with pop-up dialogs. (A) The main window, both images are displayed side-by-side. The images are masked from the original square shape such that only the overlapping regions are shown. (B) Tilt angle calculator showing the calculated tilt angle, minimum triangle area and number of triangles used in the calculation. (C) The tilt parameters least-squares minimization refinement window. The six parameters are shown with their current values and the lock button (right column) to fix individual values during refinement. (D) The DoG Picker window with four options: particle size, threshold, particle contrast, and maximum number of peaks.
Similar articles
- SPHIRE-crYOLO is a fast and accurate fully automated particle picker for cryo-EM.
Wagner T, Merino F, Stabrin M, Moriya T, Antoni C, Apelbaum A, Hagel P, Sitsel O, Raisch T, Prumbaum D, Quentin D, Roderer D, Tacke S, Siebolds B, Schubert E, Shaikh TR, Lill P, Gatsogiannis C, Raunser S. Wagner T, et al. Commun Biol. 2019 Jun 19;2:218. doi: 10.1038/s42003-019-0437-z. eCollection 2019. Commun Biol. 2019. PMID: 31240256 Free PMC article. - KLT picker: Particle picking using data-driven optimal templates.
Eldar A, Landa B, Shkolnisky Y. Eldar A, et al. J Struct Biol. 2020 May 1;210(2):107473. doi: 10.1016/j.jsb.2020.107473. Epub 2020 Feb 7. J Struct Biol. 2020. PMID: 32035993 - Maskiton: Interactive, web-based classification of single-particle electron microscopy images.
Yoshioka C, Lyumkis D, Carragher B, Potter CS. Yoshioka C, et al. J Struct Biol. 2013 May;182(2):155-63. doi: 10.1016/j.jsb.2013.02.007. Epub 2013 Feb 18. J Struct Biol. 2013. PMID: 23428431 Free PMC article. - Determining the structure of biological macromolecules by transmission electron microscopy, single particle analysis and 3D reconstruction.
Ruprecht J, Nield J. Ruprecht J, et al. Prog Biophys Mol Biol. 2001;75(3):121-64. doi: 10.1016/s0079-6107(01)00004-9. Prog Biophys Mol Biol. 2001. PMID: 11376797 Review. - High-resolution cryo-electron microscopy on macromolecular complexes and cell organelles.
Hoenger A. Hoenger A. Protoplasma. 2014 Mar;251(2):417-27. doi: 10.1007/s00709-013-0600-1. Epub 2014 Jan 5. Protoplasma. 2014. PMID: 24390311 Free PMC article. Review.
Cited by
- High throughput cytotoxicity screening of anti-HER2 immunotoxins conjugated with antibody fragments from phage-displayed synthetic antibody libraries.
Hou SC, Chen HS, Lin HW, Chao WT, Chen YS, Fu CY, Yu CM, Huang KF, Wang AH, Yang AS. Hou SC, et al. Sci Rep. 2016 Aug 23;6:31878. doi: 10.1038/srep31878. Sci Rep. 2016. PMID: 27550798 Free PMC article. - Cross-neutralization of influenza A viruses mediated by a single antibody loop.
Ekiert DC, Kashyap AK, Steel J, Rubrum A, Bhabha G, Khayat R, Lee JH, Dillon MA, O'Neil RE, Faynboym AM, Horowitz M, Horowitz L, Ward AB, Palese P, Webby R, Lerner RA, Bhatt RR, Wilson IA. Ekiert DC, et al. Nature. 2012 Sep 27;489(7417):526-32. doi: 10.1038/nature11414. Epub 2012 Sep 16. Nature. 2012. PMID: 22982990 Free PMC article. - A natural mutation between SARS-CoV-2 and SARS-CoV determines neutralization by a cross-reactive antibody.
Wu NC, Yuan M, Bangaru S, Huang D, Zhu X, Lee CD, Turner HL, Peng L, Yang L, Nemazee D, Ward AB, Wilson IA. Wu NC, et al. bioRxiv [Preprint]. 2020 Sep 21:2020.09.21.305441. doi: 10.1101/2020.09.21.305441. bioRxiv. 2020. PMID: 32995788 Free PMC article. Updated. Preprint. - Structural analysis of full-length SARS-CoV-2 spike protein from an advanced vaccine candidate.
Bangaru S, Ozorowski G, Turner HL, Antanasijevic A, Huang D, Wang X, Torres JL, Diedrich JK, Tian JH, Portnoff AD, Patel N, Massare MJ, Yates JR 3rd, Nemazee D, Paulson JC, Glenn G, Smith G, Ward AB. Bangaru S, et al. bioRxiv [Preprint]. 2020 Aug 6:2020.08.06.234674. doi: 10.1101/2020.08.06.234674. bioRxiv. 2020. PMID: 32793901 Free PMC article. Updated. Preprint. - Light-coupled cryo-plunger for time-resolved cryo-EM.
Yoder N, Jalali-Yazdi F, Noreng S, Houser A, Baconguis I, Gouaux E. Yoder N, et al. J Struct Biol. 2020 Dec 1;212(3):107624. doi: 10.1016/j.jsb.2020.107624. Epub 2020 Sep 17. J Struct Biol. 2020. PMID: 32950604 Free PMC article.
References
- Adiga U, Baxter WT, et al. Particle picking by segmentation: a comparative study with SPIDER-based manual particle picking. J Struct Biol. 2005;152(3):211–20. - PubMed
- Chen JZ, Grigorieff N. SIGNATURE: a single-particle selection system for molecular electron microscopy. J Struct Biol. 2007;157(1):168–73. - PubMed
- Frank J, Radermacher M, et al. SPIDER and WEB: processing and visualization of images in 3D electron microscopy and related fields. J Struct Biol. 1996;116(1):190–9. - PubMed
- Frigo M, Johnson SG. The Design and Implementation of FFTW3. Proceedings of the IEEE. 2005;93(2):216–231.
Publication types
MeSH terms
LinkOut - more resources
Full Text Sources
Other Literature Sources


