Septin 11 is present in GABAergic synapses and plays a functional role in the cytoarchitecture of neurons and GABAergic synaptic connectivity - PubMed (original) (raw)
Septin 11 is present in GABAergic synapses and plays a functional role in the cytoarchitecture of neurons and GABAergic synaptic connectivity
Xuejing Li et al. J Biol Chem. 2009.
Abstract
Mass spectrometry and immunoblot analysis of a rat brain fraction enriched in type-II postsynaptic densities and postsynaptic GABAergic markers showed enrichment in the protein septin 11. Septin 11 is expressed throughout the brain, being particularly high in the spiny branchlets of the Purkinje cells in the molecular layer of cerebellum and in the olfactory bulb. Immunofluorescence of cultured hippocampal neurons showed that 54 +/- 4% of the GABAergic synapses and 25 +/- 2% of the glutamatergic synapses had colocalizing septin 11 clusters. Similar colocalization numbers were found in the molecular layer of cerebellar sections. In cultured hippocampal neurons, septin 11 clusters were frequently present at the base of dendritic protrusions and at the bifurcation points of the dendritic branches. Electron microscopy immunocytochemistry of the rat brain cerebellum revealed the accumulation of septin 11 at the neck of dendritic spines, at the bifurcation of dendritic branches, and at some GABAergic synapses. Knocking down septin 11 in cultured hippocampal neurons with septin 11 small hairpin RNAs showed (i) reduced dendritic arborization; (ii) decreased density and increased length of dendritic protrusions; and (iii) decreased GABAergic synaptic contacts that these neurons receive. The results indicate that septin 11 plays important roles in the cytoarchitecture of neurons, including dendritic arborization and dendritic spines, and that septin 11 also plays a role in GABAergic synaptic connectivity.
Figures
FIGURE 1.
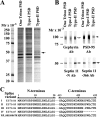
Septin 11 is enriched in a GABAergic type-II PSD fraction. A, comparative analysis by SDS-PAGE of the main protein components revealed by Coomassie Blue stain in one-Triton PSD and the fractions enriched in glutamatergic type-I PSDs and GABAergic type-II PSDs. The arrow shows the most prominent protein band (∼50 kDa) enriched in type-II PSDs. LC-MS/MS shows that septin 11 is the main component of this protein band. The same amount of total protein (4 μg) was added in each lane. B, immunoblots of the one-Triton PSD, type-I PSD fraction, and type-II PSD fraction with Rb anti-septin 11-N or Rb anti-septin 11–366 show that septin 11 (filled arrows) is enriched in type-II PSDs over type-I PSDs. Septin 11 is also present in one-Triton PSDs, which contain both type-I and type-II PSDs. Immunoblots with anti-gephyrin and anti-PSD-95 antibodies show that gephyrin (93 kDa; empty arrow) concentrates in the type-II PSD fraction, whereas PSD-95 (95 kDa; arrowhead) concentrates in type-I PSD fraction. The same amount of total protein (2 μg) in each PSD fraction was transferred to each strip. C, amino acid alignment of the N and C termini of rat septin 11 splice variants. All of the splice variants have identical amino acid sequence except for the 6 or 7 amino acids of the C terminus. The Rb anti-septin 11-N antibody was raised to amino acids 1–14 of the N terminus, which is common to all of the splice variants. The numbers at the top represent the amino acid positions.
FIGURE 2.
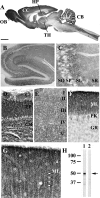
Immunocytochemical distribution of septin 11 in the rat brain. A, parasagittal section of the rat brain immunolabeled with Rb anti-septin 11-N. Very high immunoreactivity is observed in the molecular layer of the cerebellum (CB) and the olfactory bulb (OB). Less, but still high, immunoreactivity was observed in the hippocampus (HP), cerebral cortex (CC), and thalamus (TH). B–G, higher magnification of several brain regions, including the hippocampus and dentate gyrus (B), CA3 region of the hippocampus (C), olfactory bulb (D), cerebral cortex (E), cerebellum (F), and the molecular layer of the cerebellum (G). SO, stratum oriens; SP, stratum pyramidale; SL, stratum lucidum; SR, stratum radiatum; GR, granule cell layer; GL, glomerular layer; EP, external plexiform layer; ML, molecular layer; PK, Purkinje cell layer. Scale bar, 2.4 mm (A), 250 μm (B), 100 μm (D and F), 50 μm (C and E), and 20 μm (G). H, immunoblot of the P2 brain fraction with the affinity-purified antibody to septin 11 N-terminal (lane 1). The immunoreactivity of the 50-kDa protein (arrow) was blocked with 20 μg/ml antigenic peptide (lane 2).
FIGURE 3.
Septin 11 concentrates in many GABAergic synapses and also in dendritic branching points and at the base of dendritic protrusions. A–D, cultured hippocampal neurons (21 DIV) were triple-labeled with Rb anti-septin 11-N (A), guinea pig anti-γ2 (B), and sheep anti-GAD (C). The arrows show septin 11 clusters (red) colocalizing with γ2-GABAAR clusters (green) and GAD-containing boutons (blue). E–H, neurons were triple-labeled with Rb anti-septin 11–366 (E), sheep anti-GAD (F), and guinea pig anti-vGlut1 (G). The white arrowheads show septin 11 clusters (red) colocalizing with GAD-containing boutons (blue), and the black arrowhead indicates a septin 11 cluster colocalizing with vGlut1 (green). I–N, neurons were triple-labeled with guinea pig anti-γ2 (I), Rb anti-septin 11-N (J), and mouse anti-septin 7 (K). The black arrows in I, K, M, and N show septin 11 clusters (green) colocalizing with septin 7 (blue) and γ2 (red) clusters. The black arrowheads in I and M show septin 11 clusters (green) colocalizing with γ2 (red) in the absence of septin 7 clusters. The white arrows in L show septin 11 clusters (green) colocalized with septin 7 clusters (red). In L only, septin 7 is shown in red to better appreciate the colocalization with septin 11 (green) in the overlay. O–S, confocal image of the molecular layer of the rat cerebellum from brain sections triple-labeled with Rb anti-septin 11-N (P), mouse monoclonal antibody anti-gephyrin (Q), and guinea pig anti-vGAT (R). The arrows indicate septin 11 clusters (red) colocalizing with gephyrin (green) and vGAT (blue). _T–Z_′, neurons were labeled with Rb anti-septin 11-N (T and X), phalloidin-TRITC (U and Y), and monoclonal antibody MAP2 (V), and color overlays are shown in W, Z, and _Z_′. The arrow indicates septin 11 accumulating at dendritic branching points. The arrowheads point to septin 11 (green) localized at the base of dendritic protrusions. The scale bar in A represents 5 μm for A–N. The scale bar in O represents 30 μm for O and 18 μm for P–S. The scale bar in T represents 5.9 μm for T–W, 3.4 μm for X–Z, and 1.4 μm for _Z_′. over, panels with color overlays.
FIGURE 4.
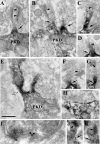
EM immunocytochemistry of rat brain cerebellum. A–H, preembedding EM immunoperoxidase labeling with anti-septin 11-N antibody of the molecular layer of the cerebellum. Immunolabeling is observed in the Purkinje cell dendrites (PKD). Intense immunolabeling is observed at the neck of the dendritic spines (filled arrows in A–D and F–G). The dendritic spines receive type-I synaptic contacts (arrowheads in A–G). Intense immunolabeling is present at the branching points of the Purkinje cell dendrites (empty arrow in E) and postsynaptically to type-II GABAergic synapses (H). I–K, postembedding EM immunogold labeling with Rb anti-septin 11-N. Gold particles are associated with the postsynaptic side of some type-II synapses (I) and with the neck (arrows) of the dendritic spines (Sp). The arrowheads point to the type-I PSD of the synaptic contacts on the spines. In H and I, the presynaptic terminal containing flattened presynaptic vesicles is located in the upper half of the panel. The scale bar represents 500 nm in all panels except in I, where it represents 155 nm.
FIGURE 5.
Knocking down septin 11 by shRNA leads to decreased dendritic arborization, decreased density, and increased length of dendritic protrusions and decreased number of GABAergic contacts that these cells receive. A, Sholl analysis of dendritic branching of the hippocampal neurons transfected with EGFP only; with EGFP plus sh1, sh1 3m, sh2, or sh2 3m; or with EGFP plus sh1 or sh2 plus the corresponding septin 11 mRNA carrying silent mutations used for rescue. B, quantification of the density and length of the dendritic protrusions in the hippocampal neurons transfected with the aforementioned plasmids. C, triple-labeled immunofluorescence of hippocampal neurons transfected with sh1 and EGFP compared with neurons transfected with sh1 3m and EGFP. The antibodies used were guinea pig anti- γ2 (red) and sheep anti-GAD (blue). The arrowheads indicate the γ2-GABAAR clusters apposed/colocalized with GAD bouton on the transfected (green) neurons. D, quantification of the density of the γ2-GABAAR clusters on the neurons transfected with the aforementioned plasmids. E, quantification of the percentage of the GABAergic synaptic contacts (GAD+ and γ2+ GABAAR) in transfected neurons compared with those of sister nontransfected neighbor neurons (100%) in the same culture. Scale bar, 5 μm in C and 2.5 μm in the selected dendrites of the right-hand panels in C. *, p < 0.05; **, p < 0.01; ***, p < 0.001.
FIGURE 6.
Overexpression of EGFP and mCherry septin 11 fusion proteins have a dominant negative effect, leading to decreased dendritic arborization, decreased density of dendritic protrusions, and decreased number of GABAergic synaptic contacts. A, Sholl analysis of the hippocampal neurons transfected with EGFP, EGFP-septin 11, nontagged septin 11 and EGFP, mCherry, mCherry-septin 11, or nontagged septin 11 and mCherry. B, quantification of the effect on the density and length of the dendritic protrusions in neurons transfected with the aforementioned plasmid constructs. C, triple-labeled immunofluorescence of hippocampal neurons transfected with EGFP compared with neurons transfected with EGFP-septin 11. The antibodies used were guinea pig anti-γ2 (red) and sheep anti-GAD (blue). The arrowheads indicate the γ2-GABAAR clusters apposed/colocalized with GAD bouton on the transfected (green) neurons. The arrow points to a large EGFP-septin aggregate on the dendrite. D, quantification of the density of the γ2 GABAAR clusters of the neurons transfected with the aforementioned plasmid constructs. E, quantification of the percentage of the GABAergic synaptic contacts (GAD+ and γ2+ GABAAR) in transfected neurons compared with those of sister nontransfected neighbor neurons (100%) in the same culture. Scale bar, 5 μm in C and 2.5 μm in the selected dendrites of C. *, p < 0.05; **, p < 0.01; ***, p ≤ 0.001.
Similar articles
- GABAergic innervation organizes synaptic and extrasynaptic GABAA receptor clustering in cultured hippocampal neurons.
Christie SB, Miralles CP, De Blas AL. Christie SB, et al. J Neurosci. 2002 Feb 1;22(3):684-97. doi: 10.1523/JNEUROSCI.22-03-00684.2002. J Neurosci. 2002. PMID: 11826098 Free PMC article. - Role of Septin cytoskeleton in spine morphogenesis and dendrite development in neurons.
Tada T, Simonetta A, Batterton M, Kinoshita M, Edbauer D, Sheng M. Tada T, et al. Curr Biol. 2007 Oct 23;17(20):1752-8. doi: 10.1016/j.cub.2007.09.039. Epub 2007 Oct 11. Curr Biol. 2007. PMID: 17935993 Free PMC article. - Low accumulation of drebrin at glutamatergic postsynaptic sites on GABAergic neurons.
Hanamura K, Mizui T, Kakizaki T, Roppongi RT, Yamazaki H, Yanagawa Y, Shirao T. Hanamura K, et al. Neuroscience. 2010 Sep 15;169(4):1489-500. doi: 10.1016/j.neuroscience.2010.06.043. Epub 2010 Jun 25. Neuroscience. 2010. PMID: 20600648 - Development and molecular organization of dendritic spines and their synapses.
Zhang W, Benson DL. Zhang W, et al. Hippocampus. 2000;10(5):512-26. doi: 10.1002/1098-1063(2000)10:5<512::AID-HIPO2>3.0.CO;2-M. Hippocampus. 2000. PMID: 11075822 Review. - Changes in the structural complexity of the aged brain.
Dickstein DL, Kabaso D, Rocher AB, Luebke JI, Wearne SL, Hof PR. Dickstein DL, et al. Aging Cell. 2007 Jun;6(3):275-84. doi: 10.1111/j.1474-9726.2007.00289.x. Epub 2007 Apr 26. Aging Cell. 2007. PMID: 17465981 Free PMC article. Review.
Cited by
- The cytoskeletal protein septin 11 is associated with human obesity and is involved in adipocyte lipid storage and metabolism.
Moreno-Castellanos N, Rodríguez A, Rabanal-Ruiz Y, Fernández-Vega A, López-Miranda J, Vázquez-Martínez R, Frühbeck G, Malagón MM. Moreno-Castellanos N, et al. Diabetologia. 2017 Feb;60(2):324-335. doi: 10.1007/s00125-016-4155-5. Epub 2016 Nov 19. Diabetologia. 2017. PMID: 27866222 - Septin 6 localizes to microtubules in neuronal dendrites.
Moon IS, Lee H, Walikonis RS. Moon IS, et al. Cytotechnology. 2013 Mar;65(2):179-86. doi: 10.1007/s10616-012-9477-7. Epub 2012 Jun 21. Cytotechnology. 2013. PMID: 22717660 Free PMC article. - In vivo transgenic expression of collybistin in neurons of the rat cerebral cortex.
Fekete CD, Goz RU, Dinallo S, Miralles CP, Chiou TT, Bear J Jr, Fiondella CG, LoTurco JJ, De Blas AL. Fekete CD, et al. J Comp Neurol. 2017 Apr 1;525(5):1291-1311. doi: 10.1002/cne.24137. Epub 2016 Nov 21. J Comp Neurol. 2017. PMID: 27804142 Free PMC article. - Effects of Septin-14 Gene Deletion on Adult Cognitive/Emotional Behavior.
Chen KR, Wang HY, Liao YH, Sun LH, Huang YH, Yu L, Kuo PL. Chen KR, et al. Front Mol Neurosci. 2022 Apr 29;15:880858. doi: 10.3389/fnmol.2022.880858. eCollection 2022. Front Mol Neurosci. 2022. PMID: 35571367 Free PMC article. - Proteome of human stem cells from periodontal ligament and dental pulp.
Eleuterio E, Trubiani O, Sulpizio M, Di Giuseppe F, Pierdomenico L, Marchisio M, Giancola R, Giammaria G, Miscia S, Caputi S, Di Ilio C, Angelucci S. Eleuterio E, et al. PLoS One. 2013 Aug 5;8(8):e71101. doi: 10.1371/journal.pone.0071101. Print 2013. PLoS One. 2013. PMID: 23940696 Free PMC article.
References
- Kinoshita M. ( 2003) J. Biochem. 134, 491– 496 - PubMed
- Joo E., Tsang C. W., Trimble W. S. ( 2005) Traffic 6, 626– 634 - PubMed
- Barral Y., Kinoshita M. ( 2008) Curr. Opin. Cell Biol. 20, 12– 18 - PubMed
- Weirich C. S., Erzberger J. P., Barral Y. ( 2008) Nat. Rev. Mol. Cell Biol. 9, 478– 489 - PubMed
Publication types
MeSH terms
Substances
LinkOut - more resources
Full Text Sources
Molecular Biology Databases
Research Materials


