A comparison of Granger causality and coherency in fMRI-based analysis of the motor system - PubMed (original) (raw)
A comparison of Granger causality and coherency in fMRI-based analysis of the motor system
Andrew S Kayser et al. Hum Brain Mapp. 2009 Nov.
Abstract
The ability of functional MRI to acquire data from multiple brain areas has spurred developments not only in voxel-by-voxel analyses, but also in multivariate techniques critical to quantifying the interactions between brain areas. As the number of multivariate techniques multiplies, however, few studies in any modality have directly compared different connectivity measures, and fewer still have done so in the context of well-characterized neural systems. To focus specifically on the temporal dimension of interactions between brain regions, we compared Granger causality and coherency (Sun et al., 2004, 2005: Neuroimage 21:647-658, Neuroimage 28:227-237) in a well-studied motor system (1) to gain further insight into the convergent and divergent results expected from each technique, and (2) to investigate the leading and lagging influences between motor areas as subjects performed a motor task in which they produced different learned series of eight button presses. We found that these analyses gave convergent but not identical results: both techniques, for example, suggested an anterior-to-posterior temporal gradient of activity from supplemental motor area through premotor and motor cortices to the posterior parietal cortex, but the techniques were differentially sensitive to the coupling strength between areas. We also found practical reasons that might argue for the use of one technique over another in different experimental situations. Ultimately, the ideal approach to fMRI data analysis is likely to involve a complementary combination of methods, possibly including both Granger causality and coherency.
The ability of functional MRI to acquire data from multiple brain areas has spurred developments not only in voxel‐by‐voxel analyses, but also in multivariate techniques critical to quantifying the interactions between brain areas. As the number of multivariate techniques multiplies, however, few studies in any modality have directly compared different connectivity measures, and fewer still have done so in the context of well‐characterized neural systems. To focus specifically on the temporal dimension of interactions between brain regions, we compared Granger causality and coherency (Sun et al., 2004, 2005: Neuroimage 21:647–658, Neuroimage 28:227–237) in a well‐studied motor system (1) to gain further insight into the convergent and divergent results expected from each technique, and (2) to investigate the leading and lagging influences between motor areas as subjects performed a motor task in which they produced different learned series of eight button presses. We found that these analyses gave convergent but not identical results: both techniques, for example, suggested an anterior‐to‐posterior temporal gradient of activity from supplemental motor area through premotor and motor cortices to the posterior parietal cortex, but the techniques were differentially sensitive to the coupling strength between areas. We also found practical reasons that might argue for the use of one technique over another in different experimental situations. Ultimately, the ideal approach to fMRI data analysis is likely to involve a complementary combination of methods, possibly including both Granger causality and coherency. Hum Brain Mapp, 2009. © 2009 Wiley‐Liss, Inc.
Figures
Figure 1
Experimental design: Subjects performed a motor task in which a cued sequence of eight finger taps (“Sequence Presentation”) was performed over 5800 ms. Each dashed line represents one of the subject's fingers (excluding the thumbs); when a “+” appeared at the corresponding position, the subject tapped that finger. A total of five finger‐tapping sequences, separated by randomized inter‐trial intervals of 2200, 4400, or 6600 ms, was performed during each task block. During the “rest” block, subjects were asked simply to maintain fixation. The conditions subsumed by the heading “other” were not analyzed in this article; refer to Sun et al. [ 2007] for details.
Figure 2
(A) Illustrates the behavior of the Granger causality difference value (GCD) as the different parameters within the simulated time series—coupling strength, latency, and sampling rate (or TR)—were varied, where each bar represents the average of 20 different time series with the same parameters but different noise inputs. Note that a particular Granger value does not uniquely specify the nature of the functional connectivity between the two time series. For a TR of 1.28 s, for example, a Granger value of ∼0.1 could represent a latency of 0.17 s with a coupling strength of 0.5, or a latency of 0.5 s with a coupling strength of 0.17. (B) Demonstrates the performance of the phase delay component of coherency on the same simulated data. Note that the phase delay measure is quite noisy when the simulated time series are uncoupled (i.e., coupling strength of zero).
Figure 3
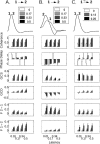
(A) In this case, a neural influence exists from area 1 to area 2, but not from area 2 to area 1. HRFs are identical (overlapping curves labeled 1 and 2). As the coupling strength (see inset) increases, the coherence increases. As the latency (see x‐axis) increases, the phase delay increases. GCS, as for coherence, varies primarily with coupling strength. GCD increases with both parameters, as do the individual components of GCD (F 1→2 and F 2→1). Note that even without any connection from area 2 to area 1, artifactual but statistically‐significant Granger influence can be noted as the latency of coupling increases. (B) In this case, the asymmetric neural influence from area 1 to area 2 remains unchanged, but the HRF for area 2 peaks earlier than that for area 1 (HRF data courtesy of Handwerker et al., 2004). Although the coherence value—which does not depend on HRF shape—remains unchanged, both the phase delay and Granger causality values reflect the shape of the HRF, not the underlying neural coupling. Moreover, as the coupling strength increases, the Granger causality value becomes progressively larger in the direction opposite the neural influence. (C) In the final case, there is a reciprocal influence between areas 1 and 2. The black arrow pointing from 1 to 2, as for (A) and (B), represents the coupling strength that is modified; the gray arrow from 2 to 1 represents a fixed coupling strength of 0.125 and a latency of 100 ms. As both the strength and the latency of the connection from 1 to 2 increase, the phase delay and GCD reflect a shift from negative to positive values.
Figure 4
Performance of the methods in more complex networks, and the role of conditional values (for both Granger causality and coherence), are shown in this figure for a simulated interaction between two hypothetical areas “1” and “2”. The first column shows the connectivity from a hypothetical area labeled “3” that is capable of providing input to both 1 and 2. The second displays the results of a conditional GCD analysis, as compared with the non‐conditional (“naive”) analysis. The third and fourth columns plot results for conditional GCS and coherence analyses, respectively. Areas 1 and 2 are either uncoupled or coupled as indicated underneath each of the three right columns. In all cases, the presence of an arrow indicates a connection strength of 0.5; the absence of an arrow (or an arrow with an “X” through it) indicates no connection. The network is configured such that area 2 influences area 1 with a latency of 500 ms, area 3 influences area 1 with a latency of 1000 ms, and area 3 influences area 2 with a latency of 500 ms. By designing the latencies in this way, we see in row D that both techniques—Granger causality and coherence—show a link between areas 1 and 2 even when there is no connection between them (dark gray bars, leftmost in each graph). Using a conditional analysis significantly reduces this effect, but does not completely eliminate it. All comparisons between naïve and conditional bars marked by an asterisk are significant (P < 0.05, Wilcoxon rank sum test). Additionally, the differences between conditional values in row D (noted by the crossbars) are significant.
Figure 5
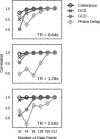
The performance of both coherency and Granger causality varies with the number of data points. On the y‐axis is shown, for each method and number of data points, the correlation of the values obtained across all nonzero coupling strengths and latencies with the data obtained for the same method in the case of 512 data points. (As a consequence, all methods show a correlation of one by construction at point 512.) Results are shown for three different TR values. In each case, phase delay requires more data before converging to asymptotic performance.
Figure 6
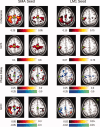
Shown in the two left columns are the results of native‐space exploratory analyses, using a seed in the SMA, for subject 212. The two right columns demonstrate results for a left M1 (LM1) seed. Areas shaded in “hot” (red–yellow) hues represent positive values; areas shaded in “cool” (blue–green) hues represent negative values. Thus, activity in a red voxel in the GCD or phase delay maps occurs after (i.e., lags) activity in the seed region. Green circles indicate the location of the SMA or LM1 ROI. Each “task” and “rest” map is created by computing the false discovery rate for a _P_‐value of 0.05, as determined by comparing with the null distribution (described in Methods). Those images marked by a green asterisk (*) contained no voxels significant at P < 0.05, corrected. Among other findings, the maps demonstrate that activity in the SMA leads, rather than lags, activity in the left M1 seed region. [Color figure can be viewed in the online issue, which is available at www.interscience.wiley.com.\]
Figure 7
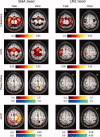
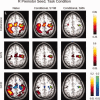
In this figure can be seen group maps thresholded at P < 0.05 (corrected) across all 14 subjects, for the range of values demonstrated by the associated color bars, for each of the analysis methods. The left two columns represent values produced for the SMA seed in both the task and rest conditions; the right two columns represent values obtained for the LM1 seed in both the task and rest conditions. Note that the slice is not identical for the two seeds (Z = 60 for the SMA seed, Z = 66 for the LM1 seed). Those images marked by a green asterisk (*) contained no voxels significant at P < 0.05, corrected. [Color figure can be viewed in the online issue, which is available at www.interscience.wiley.com.\]
Figure 8
Here the threshold on significant voxels is relaxed to P < 0.05 (uncorrected), to show the pattern of values obtained for both GCD and phase delay for the left primary somatomotor cortex (LM1) seed. In the task condition, there is a non‐significant tendency for activity in the SMA, the right premotor, and the right primary somatomotor cortex to be Granger causal for activity in LM1, while the opposite is true for activity in the bilateral posterior parietal cortices. The phase delay map is grossly concordant, though it appears to be more sensitive to BOLD signals that precede those in LM1. At rest, these timing differences are less prominent. [Color figure can be viewed in the online issue, which is available at www.interscience.wiley.com.\]
Figure 9
Here can be seen the results of the conditional analyses of the data obtained for the right premotor (PMC) ROI for subject 212 during task performance. The non‐conditional (“naive”) analysis is shown in the left column; the analysis conditioned on the stimulus is shown in the middle column; and the analysis conditioned on the SMA activity is shown in the right column. The slice was chosen to include the right PMC ROI (green circles). For the coherence analysis, conditioning on the stimulus does not markedly change the magnitude of the response, consistent with the fact that there remains significant coherence between motor areas even when no stimulus is present (i.e., in the rest condition); whereas conditioning on the SMA removes much of the coherent activity. These differences are less apparent for GCS. For GCD, the “leading” influence of the SMA on the right PMC remains after conditioning on the stimulus. Conditioning on the SMA, on the other hand, leaves small lagging and leading influences with bilateral motor/pre‐motor areas. [Color figure can be viewed in the online issue, which is available at www.interscience.wiley.com.\]
Figure 10
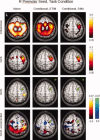
Here can be seen the results of the conditional analyses for group data obtained for the right premotor (PMC) ROI during task performance. The non‐conditional (“naive”) analysis is shown in the left column; the analysis conditioned on the stimulus is shown in the middle column; and the analysis conditioned on the SMA activity is shown in the right column (for slice Z = 58). Images in which no voxel reached a significance of P < 0.05, corrected, are denoted by green asterisks. Because such images only occur in the GCD analysis, the bottom row shows the same GCD maps for an uncorrected SnPM99 “pseudo‐_P_” value of 0.05 to reveal the underlying map structure. [Color figure can be viewed in the online issue, which is available at www.interscience.wiley.com.\]
Similar articles
- Exploring connectivity with large-scale Granger causality on resting-state functional MRI.
DSouza AM, Abidin AZ, Leistritz L, Wismüller A. DSouza AM, et al. J Neurosci Methods. 2017 Aug 1;287:68-79. doi: 10.1016/j.jneumeth.2017.06.007. Epub 2017 Jun 16. J Neurosci Methods. 2017. PMID: 28629720 Free PMC article. - Investigating directed influences between activated brain areas in a motor-response task using fMRI.
Abler B, Roebroeck A, Goebel R, Höse A, Schönfeldt-Lecuona C, Hole G, Walter H. Abler B, et al. Magn Reson Imaging. 2006 Feb;24(2):181-5. doi: 10.1016/j.mri.2005.10.022. Epub 2005 Dec 27. Magn Reson Imaging. 2006. PMID: 16455407 - Evaluation of effective connectivity of motor areas during motor imagery and execution using conditional Granger causality.
Gao Q, Duan X, Chen H. Gao Q, et al. Neuroimage. 2011 Jan 15;54(2):1280-8. doi: 10.1016/j.neuroimage.2010.08.071. Epub 2010 Sep 7. Neuroimage. 2011. PMID: 20828626 - Structural and functional evaluation of cortical motor areas in Amyotrophic Lateral Sclerosis.
Cosottini M, Pesaresi I, Piazza S, Diciotti S, Cecchi P, Fabbri S, Carlesi C, Mascalchi M, Siciliano G. Cosottini M, et al. Exp Neurol. 2012 Mar;234(1):169-80. doi: 10.1016/j.expneurol.2011.12.024. Epub 2011 Dec 27. Exp Neurol. 2012. PMID: 22226599 - Multivariate Granger causality analysis of fMRI data.
Deshpande G, LaConte S, James GA, Peltier S, Hu X. Deshpande G, et al. Hum Brain Mapp. 2009 Apr;30(4):1361-73. doi: 10.1002/hbm.20606. Hum Brain Mapp. 2009. PMID: 18537116 Free PMC article.
Cited by
- Application of Soft-Clustering to Assess Consciousness in a CLIS Patient.
Adama S, Bogdan M. Adama S, et al. Brain Sci. 2022 Dec 29;13(1):65. doi: 10.3390/brainsci13010065. Brain Sci. 2022. PMID: 36672046 Free PMC article. - The role of PFC networks in cognitive control and executive function.
Menon V, D'Esposito M. Menon V, et al. Neuropsychopharmacology. 2022 Jan;47(1):90-103. doi: 10.1038/s41386-021-01152-w. Epub 2021 Aug 18. Neuropsychopharmacology. 2022. PMID: 34408276 Free PMC article. Review. - Functional brain plasticity during L1 training on complex sentences: Changes in gamma-band oscillatory activity.
Wang P, Knösche TR, Chen L, Brauer J, Friederici AD, Maess B. Wang P, et al. Hum Brain Mapp. 2021 Aug 15;42(12):3858-3870. doi: 10.1002/hbm.25470. Epub 2021 May 4. Hum Brain Mapp. 2021. PMID: 33942956 Free PMC article. - Interrelations between dopamine and serotonin producing sites and regions of the default mode network.
de la Cruz F, Wagner G, Schumann A, Suttkus S, Güllmar D, Reichenbach JR, Bär KJ. de la Cruz F, et al. Hum Brain Mapp. 2021 Feb 15;42(3):811-823. doi: 10.1002/hbm.25264. Epub 2020 Oct 31. Hum Brain Mapp. 2021. PMID: 33128416 Free PMC article. - Overlapping connectivity patterns during semantic processing of abstract and concrete words revealed with multivariate Granger Causality analysis.
Fahimi Hnazaee M, Khachatryan E, Chehrazad S, Kotarcic A, De Letter M, Van Hulle MM. Fahimi Hnazaee M, et al. Sci Rep. 2020 Feb 18;10(1):2803. doi: 10.1038/s41598-020-59473-7. Sci Rep. 2020. PMID: 32071356 Free PMC article.
References
- Abler B,Roebroeck A,Goebel R,Höse A,Schönfeldt‐Lecuona C,Hole G,Walter H ( 2006): Investigating directed influences between activated brain areas in a motor‐response task using fMRI. Magn Reson Imaging 24: 181–185. - PubMed
- Bagarinao E,Sato S ( 2002): Algorithm for vector autoregressive model parameter estimation using an orthogonalization procedure. Ann Biomed Eng 30: 260–271. - PubMed
- Bernasconi C,Koenig P ( 1999): On the directionality of cortical interactions studied by structural analysis of electrophysiological recordings. Biol Cybern 81: 199–210. - PubMed
- Biswal B,Yetkin FZ,Haughton VM,Hyde JS ( 1995): Functional connectivity in the motor cortex of resting human brain using echo‐planar MRI. Magn Reson Med 34: 537–541. - PubMed
Publication types
MeSH terms
Substances
Grants and funding
- P01 NS040813/NS/NINDS NIH HHS/United States
- MH63901/MH/NIMH NIH HHS/United States
- R01 MH063901/MH/NIMH NIH HHS/United States
- R01 MH063901-08/MH/NIMH NIH HHS/United States
- NS40813/NS/NINDS NIH HHS/United States
LinkOut - more resources
Full Text Sources
Research Materials


