Polycomb protein Ezh2 regulates pancreatic beta-cell Ink4a/Arf expression and regeneration in diabetes mellitus - PubMed (original) (raw)
Polycomb protein Ezh2 regulates pancreatic beta-cell Ink4a/Arf expression and regeneration in diabetes mellitus
Hainan Chen et al. Genes Dev. 2009.
Abstract
Proliferation of pancreatic islet beta cells is an important mechanism for self-renewal and for adaptive islet expansion. Increased expression of the Ink4a/Arf locus, which encodes the cyclin-dependent kinase inhibitor p16(INK4a) and tumor suppressor p19(Arf), limits beta-cell regeneration in aging mice, but the basis of beta-cell Ink4a/Arf regulation is poorly understood. Here we show that Enhancer of zeste homolog 2 (Ezh2), a histone methyltransferase and component of a Polycomb group (PcG) protein complex, represses Ink4a/Arf in islet beta cells. Ezh2 levels decline in aging islet beta cells, and this attrition coincides with reduced histone H3 trimethylation at Ink4a/Arf, and increased levels of p16(INK4a) and p19(Arf). Conditional deletion of beta-cell Ezh2 in juvenile mice also reduced H3 trimethylation at the Ink4a/Arf locus, leading to precocious increases of p16(INK4a) and p19(Arf). These mutant mice had reduced beta-cell proliferation and mass, hypoinsulinemia, and mild diabetes, phenotypes rescued by germline deletion of Ink4a/Arf. beta-Cell destruction with streptozotocin in controls led to increased Ezh2 expression that accompanied adaptive beta-cell proliferation and re-establishment of beta-cell mass; in contrast, mutant mice treated similarly failed to regenerate beta cells, resulting in lethal diabetes. Our discovery of Ezh2-dependent beta-cell proliferation revealed unique epigenetic mechanisms underlying normal beta-cell expansion and beta-cell regenerative failure in diabetes pathogenesis.
Figures
Figure 1.
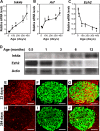
Declining Ezh2 expression accompanies increased Ink4a/Arf expression in mouse pancreatic β cells during aging. Relative mRNA levels of Ink4a (A), Arf (B), and Ezh2 (C) in mouse pancreatic islets at the indicated ages, as determined by real-time RT–PCR. n = 3 to 10 mice per time point. (*) P < 0.05, (**) P < 0.01 compared with values derived from islets of 10-d-old mice. (D) Representative Western blot analysis of the indicated proteins in islets from mice at the indicated ages. Each lane contains total protein from an individual mouse islet lysate. (E–J) Representative images of pancreatic islets and adjacent tissues following immunostaining for Ezh2 (red) and insulin (green) in young (23-d-old, E–G) and old (384-d-old, H–J) mice. G is a merged image of E and F, and J is a merge of H and I. Bar, 25 μm.
Figure 2.
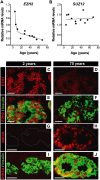
Decreased EZH2 expression in aging is conserved in human pancreatic islet β cells. Relative mRNA levels of EZH2 (A) and SUZ12 (B) in human pancreatic islets at the indicated ages, as determined by real-time RT–PCR. Each dot represents the value from an individual subject. (C–J) Representative images of pancreatic islets and adjacent tissues following immunostaining for EZH2 (red), INK4A (red) and insulin (green) in 2-yr-old (C,E,G,I) and 75-yr-old (D,F,H,J) subjects. Similar results were obtained with repeated observations of pancreas sections from three young donors (<10 yr old) and three older donors (>60 yr old). Bar, 25 μm.
Figure 3.
Dynamic Ezh2 association and histone modification at the Ink4a/Arf locus in aging pancreatic islets. (A) A schematic of the mouse Cdkn2a/2b locus that encodes the linked mouse genes Ink4a, Arf, and Ink4b. The relative position of amplicons (1, 2, 3, 4, and 5) used for ChIP assays is marked by black bars. Primer sequences were listed in Supplemental Table 2. ChIP analysis was performed with the indicated amplicons and antibodies recognizing Ezh2 (B), H3K27me3 (C), H3K4me3 (D), H3K9/14Ac (E), H3K9me3 (F), and IgG control (G) in pancreatic islets purified from young (1-mo-old) and old (10∼12-mo-old, Avg. 11 mo) C57BL/6 mice. DNA enrichments are presented as percentages of total input. Three to five independent ChIP experiments were performed for each antibody using separate islet preparations. (*) P < 0.05 for 1 mo versus 11 mo.
Figure 4.
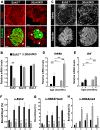
Premature increase of Ink4a/Arf expression in pancreatic β cells lacking Ezh2. (A) Immunofluorescence staining of Ezh2 and insulin in pancreas sections from βEzh2KO and control (Ezh2f/f) mice at 1 mo of age. Ezh2 in βEzh2KO islet β cells that express insulin (arrowheads) is markedly reduced compared with levels in non-β cells (arrows), or in islet β cells of control mice. (B) Relative mRNA levels of Ezh2, Suz12, and Bmi-1 in control Ezh2f/f and βEzh2KO islets from 1-mo-old mice, as measured by real-time RT–PCR. (C) Immunostaining of Ink4a and insulin in pancreas sections from 1-mo-old mice. (D,E) Relative mRNA levels of Ink4a (D) and Arf (E) in isolated islets from control Ezh2f/f and βEzh2KO mice. n = 4–10 mice per group. (F–H) ChIP analysis of the Ink4b and Ink4a/Arf loci using the indicated amplicons (shown in Fig. 3A) and antibodies in islets from 1-mo-old control Ezh2f/f and βEzh2KO mice. Three to five independent ChIP experiments were performed for each antibody using separate islet preparations. (*) P < 0.05, (**) P < 0.01 for βEzh2KO versus control Ezh2f/f or for comparisons indicated. Bar, 25 μm.
Figure 5.
β-cell hypoplasia and mild diabetes mellitus in βEzh2KO mice. (A) Fasting blood glucose levels in 1-mo-old mice. n = 15–18 for each group. (B) Post-prandial blood glucose levels in male βEzh2KO and littermate control Ezh2f/f mice at the indicated age. n = 10–16 for each group. (C) Glucose tolerance testing performed on 1-mo-old mice after an intraperitoneal injection of 3 g/kg body weight glucose. n = 10 for Ezh2f/f, and n = 13 for βEzh2KO mice. (D) Area under curve (AUC) from C. (E) Plasma insulin levels at indicated times following glucose injections in 1-mo-old control Ezh2f/f and βEzh2KO mice. n = 6 mice for each group. (F) Total pancreas insulin content of control Ezh2f/f and βEzh2KO mice measured at the indicated ages. n = 5–8 mice per group. (G) Pancreatic β-cell mass of Ezh2f/f and βEzh2KO mice at the indicated ages. n = 4–6 mice for each group. (H) Representative images showing BrdU (red) and insulin (green) immunostaining in pancreatic islets from 1-mo-old mice after injection with BrdU. BrdU+ cells, not costained with insulin, were not counted as BrdU+ β cells. (I) Quantification of BrdU+ insulin+ cells as a percentage of all insulin+ cells. n = 5 mice for each group. In total, at least 200 islets per genotype were investigated. A and I are box-whisker plots. (*) P < 0.05, (**) P < 0.01, (***) P < 0.001 for Ezh2f/f versus βEzh2KO. Bar, 25 μm.
Figure 6.
Germline deletion of Cdkn2a rescues glucose metabolism and β-cell proliferation defects in βEzh2KO mice. (A) Fasting blood glucose in male triple knockout mice lacking Ezh2 in β cells and Ink4a/Arf (designated as βEzh2KO; Cdkn2a−/−), and βEzh2KO and littermate control Ezh2f/f mice tested at 1 mo. n = 6–11 for each group. (B) Glucose tolerance testing. (C) Area under curve (AUC) from B. (D) Plasma insulin levels at the indicated times following glucose injections assessed in 1-mo-old mice after overnight fasting. n = 5–6 for each group. (E–G) Total pancreas insulin content (E), pancreatic β-cell mass (F), and quantification of BrdU+ insulin+ cells as a percentage of all insulin+ cells (G) in male triple knockout βEzh2KO; Cdkn2a−/− mice, and βEzh2KO and littermate control Ezh2f/f mice at 1 mo. n = 3–4 mice for each group. A, F, and G are box-whisker plots. (*) P < 0.05, (**) P < 0.01, (***) P < 0.001. (NS) Not significant.
Figure 7.
Failure of β-cell regeneration and recovery from STZ-induced diabetes in βEzh2KO mice. (A) Representative images of pancreatic islets and adjacent tissues following immunostaining for Ezh2 and insulin in 6-wk-old Ezh2f/f mice 15 d after receiving a single intraperitoneal injection of sodium citrate (Vehicle) or STZ (100 mg/kg body weight). Relative to the Vehicle group, STZ induces a high level of Ezh2 expression in insulin+ cells. (B,C) Relative mRNA levels of Ezh2, Ezh1(B) and Ink4a, Arf (C) in islets from 6-wk-old Ezh2f/f mice 6 d after vehicle or STZ treatment. n = 4–5 mice per group. (D) Representative images showing Ink4a/insulin and BrdU/insulin immunostaining in pancreatic islets from 6-wk-old Ezh2f/f and βEzh2KO mice 15 d after STZ treatment. (E) Quantification of BrdU+ cells as a percentage in all insulin+ cells (Islet) or in noninsulin+ cells (Acinar) from D. n = 3 or 4 mice for each group. (F) Pancreatic β-cell mass of Ezh2f/f and βEzh2KO mice assessed at 5, 15, and 62 d after STZ treatment. n = 3 or 4 mice for each group. (G) Blood glucose levels in Ezh2f/f and βEzh2KO mice after STZ treatment. (H) Percentage survival after STZ treatment. n = 24 for Ezh2f/f and n = 20 for βEzh2KO in G and H. The dose of STZ injection was 150 mg/kg body weight from D to H. (*) P < 0.05, (**) P < 0.01 for comparison between vehicle versus STZ, Ezh2f/f versus βEzh2KO, or for comparison as indicated. Bar, 25 μm.
Similar articles
- Combined modulation of polycomb and trithorax genes rejuvenates β cell replication.
Zhou JX, Dhawan S, Fu H, Snyder E, Bottino R, Kundu S, Kim SK, Bhushan A. Zhou JX, et al. J Clin Invest. 2013 Nov;123(11):4849-58. doi: 10.1172/JCI69468. J Clin Invest. 2013. PMID: 24216481 Free PMC article. - Polycomb mediated epigenetic silencing and replication timing at the INK4a/ARF locus during senescence.
Agherbi H, Gaussmann-Wenger A, Verthuy C, Chasson L, Serrano M, Djabali M. Agherbi H, et al. PLoS One. 2009 May 20;4(5):e5622. doi: 10.1371/journal.pone.0005622. PLoS One. 2009. PMID: 19462008 Free PMC article. - Enhancer of zeste homolog 2 depletion induces cellular senescence via histone demethylation along the INK4/ARF locus.
Jie B, Weilong C, Ming C, Fei X, Xinghua L, Junhua C, Guobin W, Kaixiong T, Xiaoming S. Jie B, et al. Int J Biochem Cell Biol. 2015 Aug;65:104-12. doi: 10.1016/j.biocel.2015.05.011. Epub 2015 May 22. Int J Biochem Cell Biol. 2015. PMID: 26004298 - Role of Ink4a/Arf locus in beta cell mass expansion under physiological and pathological conditions.
Salas E, Rabhi N, Froguel P, Annicotte JS. Salas E, et al. J Diabetes Res. 2014;2014:873679. doi: 10.1155/2014/873679. Epub 2014 Feb 6. J Diabetes Res. 2014. PMID: 24672805 Free PMC article. Review. - Long noncoding RNA, polycomb, and the ghosts haunting INK4b-ARF-INK4a expression.
Aguilo F, Zhou MM, Walsh MJ. Aguilo F, et al. Cancer Res. 2011 Aug 15;71(16):5365-9. doi: 10.1158/0008-5472.CAN-10-4379. Epub 2011 Aug 9. Cancer Res. 2011. PMID: 21828241 Free PMC article. Review.
Cited by
- BIM promoter directly targeted by EBNA3C in polycomb-mediated repression by EBV.
Paschos K, Parker GA, Watanatanasup E, White RE, Allday MJ. Paschos K, et al. Nucleic Acids Res. 2012 Aug;40(15):7233-46. doi: 10.1093/nar/gks391. Epub 2012 May 14. Nucleic Acids Res. 2012. PMID: 22584624 Free PMC article. - Targeted overexpression of CKI-insensitive cyclin-dependent kinase 4 increases functional β-cell number through enhanced self-replication in zebrafish.
Li M, Maddison LA, Crees Z, Chen W. Li M, et al. Zebrafish. 2013 Jun;10(2):170-6. doi: 10.1089/zeb.2012.0816. Epub 2013 Apr 1. Zebrafish. 2013. PMID: 23544990 Free PMC article. - Regulation of Peripheral Nerve Myelin Maintenance by Gene Repression through Polycomb Repressive Complex 2.
Ma KH, Hung HA, Srinivasan R, Xie H, Orkin SH, Svaren J. Ma KH, et al. J Neurosci. 2015 Jun 3;35(22):8640-52. doi: 10.1523/JNEUROSCI.2257-14.2015. J Neurosci. 2015. PMID: 26041929 Free PMC article. - Genetic syndromes caused by mutations in epigenetic genes.
Berdasco M, Esteller M. Berdasco M, et al. Hum Genet. 2013 Apr;132(4):359-83. doi: 10.1007/s00439-013-1271-x. Epub 2013 Jan 31. Hum Genet. 2013. PMID: 23370504 Review. - Ring1b bookmarks genes in pancreatic embryonic progenitors for repression in adult β cells.
van Arensbergen J, García-Hurtado J, Maestro MA, Correa-Tapia M, Rutter GA, Vidal M, Ferrer J. van Arensbergen J, et al. Genes Dev. 2013 Jan 1;27(1):52-63. doi: 10.1101/gad.206094.112. Epub 2012 Dec 27. Genes Dev. 2013. PMID: 23271347 Free PMC article.
References
- Bracken A.P., Kleine-Kohlbrecher D., Dietrich N., Pasini D., Gargiulo G., Beekman C., Theilgaard-Monch K., Minucci S., Porse B.T., Marine J.C., et al. The Polycomb group proteins bind throughout the INK4A–ARF locus and are disassociated in senescent cells. Genes & Dev. 2007;21:525–530. - PMC - PubMed
- Cao R., Wang L.J., Wang H.B., Xia L., Erdjument-Bromage H., Tempst P., Jones R.S., Zhang Y. Role of histone H3 lysine 27 methylation in polycomb-group silencing. Science. 2002;298:1039–1043. - PubMed
- Chen H.N., Carlson E.C., Pellet L., Moritz J.T., Epstein P.N. Overexpression of metallothionein in pancreatic β-cells reduces streptozotocin-induced DNA damage and diabetes. Diabetes. 2001;50:2040–2046. - PubMed
Publication types
MeSH terms
Substances
LinkOut - more resources
Full Text Sources
Other Literature Sources
Medical
Molecular Biology Databases


