WNK4 diverts the thiazide-sensitive NaCl cotransporter to the lysosome and stimulates AP-3 interaction - PubMed (original) (raw)
WNK4 diverts the thiazide-sensitive NaCl cotransporter to the lysosome and stimulates AP-3 interaction
Arohan R Subramanya et al. J Biol Chem. 2009.
Abstract
With-no-lysine kinase 4 (WNK4) inhibits electroneutral sodium chloride reabsorption by attenuating the cell surface expression of the thiazide-sensitive NaCl cotransporter (NCC). The underlying mechanism for this effect remains poorly understood. Here, we explore how WNK4 affects the trafficking of NCC through its interactions with intracellular sorting machinery. An analysis of NCC cell surface lifetime showed that WNK4 did not alter the net rate of cotransporter internalization. In contrast, direct measurements of forward trafficking revealed that WNK4 attenuated the rate of NCC surface delivery, inhibiting the anterograde movement of cotransporters traveling to the plasma membrane from the trans-Golgi network. The response was paralleled by a dramatic reduction in NCC protein abundance, an effect that was sensitive to the lysosomal protease inhibitor leupeptin, insensitive to proteasome inhibition, and attenuated by endogenous WNK4 knockdown. Subcellular localization studies performed in the presence of leupeptin revealed that WNK4 enhanced the accumulation of NCC in lysosomes. Moreover, NCC immunoprecipitated with endogenous AP-3 complexes, and WNK4 increased the fraction of cotransporters that associate with this adaptor, which facilitates cargo transport to lysosomes. WNK4 expression also increased LAMP-2-positive lysosomal content, indicating that the kinase may act by a general AP-3-dependent mechanism to promote cargo delivery into the lysosomal pathway. Taken together, these findings indicate that WNK4 inhibits NCC activity by diverting the cotransporter to the lysosome for degradation by way of an AP-3 transport carrier.
Figures
FIGURE 1.
WNK4 does not affect the rate of NCC retrieval from the plasma membrane. A, decay in thiazide-sensitive 22Na+ transport, measured in NCC-expressing X. laevis oocytes, assessed in the absence or presence of WNK4-(168–1222), a WNK4 construct that stably suppresses NCC activity (12, 13). Measurements were taken after NCC was maximally expressed at the cell surface (4 days post-injection), and oocytes were placed in medium containing 10μM BFA. Each data point represents the mean 22Na+ uptake per oocyte ± S.E., normalized to t = 0. For each time point 22Na+ fluxes were measured in 80–120 oocytes from 4 frogs across 4 separate experiments. B, cell surface half-lives of NCC expressed in the absence or presence of WNK4 during BFA incubation, derived from the data shown in A. p value = 0.7483 by Student's t test.
FIGURE 2.
WNK4 inhibits NCC cell surface delivery in X. laevis oocytes. A, effect of BFA washout on 22Na+ transport, measured in NCC-expressing oocytes preincubated in medium containing 10 μ
m
BFA for 10 h. Measurements were taken 4 days post-injection. Data were normalized to NCC activity at t = 0. The dashed line is based on data from Fig. 1_A. B_, time course of 22Na+ transport in oocytes expressing NCC in the absence or presence of WNK4-(168–1222) during the first 8 h after BFA washout. For panels A and B, each data point represents the mean 22Na+ uptake per oocyte ± S.E., normalized to t = 0. For each time point, 22Na+ fluxes were measured in 50–70 oocytes from 2 frogs across 2 separate experiments. C, forward trafficking rate of NCC expressed in the absence or presence of WNK4 during the BFA washout phase, derived from the slopes of the data shown in B. *, p = 0.005 by Student's t test.
FIGURE 3.
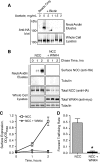
WNK4 inhibits NCC TGN-to-cell surface delivery in HEK-293H cells. A, acetylation of NCC expressed at the plasma membrane blocks cell surface biotinylation. HEK-293H cells were transiently transfected with amino-terminal HA-tagged NCC (HA-NCC) and treated with various concentrations of Sulfo-NHS acetate for 1 h at 4 °C. The acetate compound was then quenched in Tris-containing buffer, and the cells were washed and treated with Sulfo-NHS-SS-Biotin for 1 h at 4 °C. As the concentration of Sulfo-NHS acetate is increased, the amount of surface biotinylated NCC pulled down by the NeutrAvidin-agarose beads decreases. B, time course of HA-NCC delivery to the cell surface from the TGN in cells co-expressing either empty vector (NCC) or Myc-WNK4 (NCC + WNK4). 48 h after transfection cells were pretreated with Sulfo-NHS acetate then placed at 20 °C for 2 h to block biosynthetic traffic at the Golgi. Samples were then warmed to 37 °C and biotinylated at subsequent time points. Western blots of NeutrAvidin eluates and whole cell lysates were performed for HA-NCC and tubulin, an intracellular control. C, plot of HA-NCC surface expression, measured by densitometry at various points during the time course (ODtz), normalized to maximum HA-NCC surface expression (at 2 h, ODmax). For each experimental group, surface NCC protein abundance was normalized to the whole cell lysate NCC protein densities measured at t = 0. Mean ± S.E., n = 3. D, quantification of the HA-NCC forward trafficking rate, derived as the slopes of the data shown in C. *, p = 0.0024 by Student's t test.
FIGURE 4.
Development of a functional externally tagged cotransporter. A, NCC schematic showing the location of the double hemagglutinin epitope tag. B, 22Na+ transport measurements of wild type and 2×HA-NCC (mean ± S.E.; fluxes measured in 58–65 oocytes from 2 separate frogs across 3 experiments). C, Western blot of whole cell lysates from Xenopus oocytes expressing wild type NCC and 2×HA-NCC, using anti-amino-terminal NCC (14) and anti-HA antibodies. D, epifluorescence images of immunostained COS-7 cells transiently transfected with wild type NCC or 2×HA-NCC under permeabilized or nonpermeabilized conditions using primary antibodies directed to an intracellular amino-terminal NCC epitope (Cy3/red) or the extracellular HA epitope (fluorescein isothiocyanate/green). Results are representative of three experiments.
FIGURE 5.
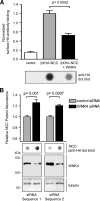
WNK4 decreases steady state NCC surface expression and total protein abundance in HEK-293 cells. A, top, quantitative cell surface HA antibody binding and luminometry in cells transiently expressing 1 μg/well empty vector, 0.5 μg/well 2×HA-NCC plus 0.5μg/well empty vector, or 0.5 μg/well 2×HA-NCC plus 0.5μg/well WNK4 (mean ± S.E., n = 4). Bottom, anti-HA dot blot of whole cell lysates (7 μg of protein) from HEK-293H cells transiently transfected in parallel to the luminometry assays shown in the top panel. Representative of four experiments. B, HEK-293H cells stably expressing 2×HA-NCC were transiently transfected twice with siRNAs directed against human WNK4 or a control scrambled siRNA, as described under “Experimental Procedures.” 24 h after the second transfection cells were harvested, and 4 μg of the whole cell lysates were subjected to immunoblotting. Results are the mean ± S.E., n = 6 for siRNA Sequence 1, n = 4 for siRNA Sequence 2.
FIGURE 6.
WNK4 diverts NCC to the lysosomal pathway. A, protein densitometry measurements of HEK-293H cells transiently expressing 2×HA-NCC plus empty vector or 2×HA-NCC plus WNK4, treated in the absence and presence of leupeptin (10 μ
m
for 14 h) and MG-132 (5 μ
m
for 18 h). Shown below the bar graphs are representative anti-HA dot blots of the whole cell lysates (7 μg). For the MG-132-treated samples, the exposure time of the blot was shortened to avoid oversaturation of the film and improve quantitative accuracy. In cells expressing NCC and WNK4, leupeptin but not MG-132 treatment significantly attenuated the reduction in total cotransporter protein density caused by WNK4 (mean ± S.E., n = 4–6 experiments). *, p < 0.05 by one-way analysis of variance, Dunnett's post-hoc test. B, cell surface luminometry measurements of cells transiently expressing NCC in the absence or presence of WNK4 treated with 10 μ
m
leupeptin for 14 h. The cell surface expression measurements were normalized to the total NCC protein density of transfected and leupeptin-treated whole cell lysates prepared in parallel to the luminometry assays. A representative anti-HA dot blot of the protein densities (7 μg of whole cell lysate) is shown below the bar graph (mean ± S.E., n = 4). C, laser scanning confocal images of HEK-293H cells stably expressing 2×HA-NCC, transiently transfected with either empty vector or Myc-tagged WNK4, and treated with leupeptin for 14 h. HA-tagged NCC and endogenous LAMP-2 were labeled using Alexa Fluor 488- and 568-conjugated secondary antibodies, respectively. In samples transiently transfected with WNK4, cells expressing Myc epitopes were identified using Alexa Fluor 635 secondary antibodies (not shown). Scale bar = 10 μm. D, quantification of the degree of overlap between the 2×HA-NCC and LAMP-2 signals in the absence and presence of WNK4. Results are the mean ± S.E., n = 20 cells per group collected across three separate transfections.
FIGURE 7.
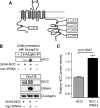
WNK4 stimulates NCC interaction with endogenous AP-3 complexes. A, schematic showing the location of five putative canonical AP-3 binding motifs embedded within the mouse NCC cytoplasmic domains. All of the identified sequences are tyrosine-based, are conserved in human NCC, and conform to the sequence Y_XX_ø. B, top, HEK-293H cells stably expressing 2×HA-NCC were transiently transfected with empty vector or Myc-WNK4, treated with leupeptin for 14 h before lysis. Whole cell lysates were subject to immunoprecipitation with anti-δ-adaptin antibody and immunoblotted with anti-HA antibody. Bottom, 3% of the whole cell lysate inputs for the immunoprecipitation (IP) were immunoblotted (IB) for 2×HA-NCC, Myc-WNK4, and endogenous δ-adaptin. C, quantification of the NCC signal in the δ-adaptin immunoprecipitates, measured by protein densitometry (mean ± S.E., n = 3).
FIGURE 8.
WNK4 promotes a generalized increase in total lysosomal content. A, laser-scanning confocal images of HEK-293H cells transiently transfected with either empty vector or Myc-tagged WNK4, pretreated with leupeptin for 14 h. Endogenous LAMP-2 was labeled using an Alexa Fluor 488-conjugated secondary antibodies. Cells expressing Myc epitopes were identified using an Alexa Fluor 568-conjugated secondary antibodies (not shown), and images of the LAMP-2 positive signal were superimposed over concurrently taken differential interference contrast images. Cell outlines are marked with a dotted line. Representative lysosomal structures are indicated with arrowheads. Scale bar = 10 μm. B, quantification of the total LAMP-2-positive signal per cell (Alysosome) expressed as a percentage of total cytoplasmic area (Acytoplasm) (mean ± S.E., n = 27–31 cells per experimental group, collected across three separate transfections).
Similar articles
- WNK kinases regulate thiazide-sensitive Na-Cl cotransport.
Yang CL, Angell J, Mitchell R, Ellison DH. Yang CL, et al. J Clin Invest. 2003 Apr;111(7):1039-45. doi: 10.1172/JCI17443. J Clin Invest. 2003. PMID: 12671053 Free PMC article. - WNK4 enhances the degradation of NCC through a sortilin-mediated lysosomal pathway.
Zhou B, Zhuang J, Gu D, Wang H, Cebotaru L, Guggino WB, Cai H. Zhou B, et al. J Am Soc Nephrol. 2010 Jan;21(1):82-92. doi: 10.1681/ASN.2008121275. Epub 2009 Oct 29. J Am Soc Nephrol. 2010. PMID: 19875813 Free PMC article. - Aldosterone mediates activation of the thiazide-sensitive Na-Cl cotransporter through an SGK1 and WNK4 signaling pathway.
Rozansky DJ, Cornwall T, Subramanya AR, Rogers S, Yang YF, David LL, Zhu X, Yang CL, Ellison DH. Rozansky DJ, et al. J Clin Invest. 2009 Sep;119(9):2601-12. doi: 10.1172/JCI38323. Epub 2009 Aug 17. J Clin Invest. 2009. PMID: 19690383 Free PMC article. - Exploring the intricate regulatory network controlling the thiazide-sensitive NaCl cotransporter (NCC).
Dimke H. Dimke H. Pflugers Arch. 2011 Dec;462(6):767-77. doi: 10.1007/s00424-011-1027-1. Epub 2011 Sep 17. Pflugers Arch. 2011. PMID: 21927811 Free PMC article. Review. - The regulation of Na+Cl- cotransporter by with-no-lysine kinase 4.
Argaiz ER, Gamba G. Argaiz ER, et al. Curr Opin Nephrol Hypertens. 2016 Sep;25(5):417-23. doi: 10.1097/MNH.0000000000000247. Curr Opin Nephrol Hypertens. 2016. PMID: 27322883 Review.
Cited by
- WNK signalling pathways in blood pressure regulation.
Murthy M, Kurz T, O'Shaughnessy KM. Murthy M, et al. Cell Mol Life Sci. 2017 Apr;74(7):1261-1280. doi: 10.1007/s00018-016-2402-z. Epub 2016 Nov 4. Cell Mol Life Sci. 2017. PMID: 27815594 Free PMC article. Review. - WNK4 kinase inhibits Maxi K channel activity by a kinase-dependent mechanism.
Zhuang J, Zhang X, Wang D, Li J, Zhou B, Shi Z, Gu D, Denson DD, Eaton DC, Cai H. Zhuang J, et al. Am J Physiol Renal Physiol. 2011 Aug;301(2):F410-9. doi: 10.1152/ajprenal.00518.2010. Epub 2011 May 25. Am J Physiol Renal Physiol. 2011. PMID: 21613417 Free PMC article. - The thiazide-sensitive NaCl cotransporter is targeted for chaperone-dependent endoplasmic reticulum-associated degradation.
Needham PG, Mikoluk K, Dhakarwal P, Khadem S, Snyder AC, Subramanya AR, Brodsky JL. Needham PG, et al. J Biol Chem. 2011 Dec 23;286(51):43611-43621. doi: 10.1074/jbc.M111.288928. Epub 2011 Oct 25. J Biol Chem. 2011. PMID: 22027832 Free PMC article. - An unexpected journey: conceptual evolution of mechanoregulated potassium transport in the distal nephron.
Carrisoza-Gaytan R, Carattino MD, Kleyman TR, Satlin LM. Carrisoza-Gaytan R, et al. Am J Physiol Cell Physiol. 2016 Feb 15;310(4):C243-59. doi: 10.1152/ajpcell.00328.2015. Epub 2015 Dec 2. Am J Physiol Cell Physiol. 2016. PMID: 26632600 Free PMC article. Review. - Enhanced phosphorylation of Na(+)-Cl- co-transporter in experimental metabolic syndrome: role of insulin.
Komers R, Rogers S, Oyama TT, Xu B, Yang CL, McCormick J, Ellison DH. Komers R, et al. Clin Sci (Lond). 2012 Dec;123(11):635-47. doi: 10.1042/CS20120003. Clin Sci (Lond). 2012. PMID: 22651238 Free PMC article.
References
- Kahle K. T., Ring A. M., Lifton R. P. ( 2008) Annu. Rev. Physiol. 70, 329– 355 - PubMed
- Kahle K. T., Wilson F. H., Leng Q., Lalioti M. D., O'Connell A. D., Dong K., Rapson A. K., MacGregor G. G., Giebisch G., Hebert S. C., Lifton R. P. ( 2003) Nat. Genet. 35, 372– 376 - PubMed
- Wilson F. H., Disse-Nicodème S., Choate K. A., Ishikawa K., Nelson-Williams C., Desitter I., Gunel M., Milford D. V., Lipkin G. W., Achard J. M., Feely M. P., Dussol B., Berland Y., Unwin R. J., Mayan H., Simon D. B., Farfel Z., Jeunemaitre X., Lifton R. P. ( 2001) Science 293, 1107– 1112 - PubMed
Publication types
MeSH terms
Substances
Grants and funding
- R01 DK063049/DK/NIDDK NIH HHS/United States
- DK054231/DK/NIDDK NIH HHS/United States
- R01 DK054231/DK/NIDDK NIH HHS/United States
- DK051496/DK/NIDDK NIH HHS/United States
- R56 DK054231/DK/NIDDK NIH HHS/United States
- DK072865/DK/NIDDK NIH HHS/United States
- F32 DK072865/DK/NIDDK NIH HHS/United States
- DK063049/DK/NIDDK NIH HHS/United States
- R01 DK051496/DK/NIDDK NIH HHS/United States
LinkOut - more resources
Full Text Sources
Other Literature Sources
Medical
Molecular Biology Databases


