How single molecule detection measures the dynamic actions of life - PubMed (original) (raw)
How single molecule detection measures the dynamic actions of life
Yoshiharu Ishii et al. HFSP J. 2007 May.
Abstract
Biomolecules dynamically work in cells in which a variety of molecules assemble and interact in unique manner. The molecular mechanisms underlying several biological processes have been elucidated from the results obtained from the descriptions of cell function, from the snapshots of the structures of biomolecules involved in these processes, and from the biochemical properties of these reactions in vitro. Recently developed single molecule measurements have revealed the dynamic properties of the biomolecules that have been hidden in the data that have been averaged over large numbers of molecules in both ensemble measurement and in cells. Single molecule imaging and manipulation of single molecules have allowed the visualization of the dynamic operations of molecular motors, enzymatic reactions, structural dynamics of biomolecules, and cell signaling processes. The results have shown that the single molecule techniques are powerful tools to monitor the dynamic actions of biomolecules and their assemblies. This approach has been applied to a variety of fields within the life sciences. As new information emerges about the dynamic actions of biomolecules using methods of single molecule detection new views on how biological processes work will be revealed.
Figures
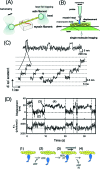
Figure 1. Single molecule imaging.
(A) Schematic drawing of a basic system of illuminating single fluorescent molecules on the glass surface in total internal reflection fluorescence microscopy (above) and typical images of single molecules. (B) Visualization of the sliding movement of a GFP-tagged myosin molecule along an actin filament immobilized on the glass surface. (C) Visualization of the turnover of ATP hydrolysis by a single myosin molecule on a glass surface.
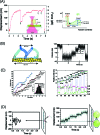
Figure 2. Single molecule manipulation and step movement of nonprocessive muscle myosin II.
(A) A single actin filament is manipulated through two beads attached at both ends using a laser trap. For mechanical measurements, the actin filament interacts with a myosin molecule immobilized on a pedestal in the presence of ATP. The movement caused by single myosin molecules can be measured by recording the displacement of one of the beads. (B) A single myosin molecule is attached to a tip of a microneedle and manipulated. The movement of a single myosin molecule is measured from displacement of the tip of the microneedle, when it interacts with actin filaments on the glass surface. (C) Displacement records of the movement of muscle myosin II on an actin filament using a scanning probe microscope. Cycles of the step movement of myosin and its return to the original position were monitored as in a laser trap measurement (top). The rising phase of the step movement was expanded and substeps of 5.5 nm were monitored. (D) Simultaneous measurement of the mechanical movement measured using a laser trap (top) and ATP hydrolysis turnover measured using single molecule imaging (bottom) with a fluorescent ATP analogue. Myosin strongly interacting with actin (1) dissociates upon binding of ATP to myosin. Myosin interacts weakly with actin (2) and generates mechanical motion when Pi and ADP dissociates from myosin (3) and then myosin interacts with actin strongly (4 and 1).
Figure 3. Step movement of processive molecular motors.
(A) The step movement of kinesin was measured by attaching to a bead trapped by a laser. Successive stepping movements were monitored as the external force increased up to 7 pN (left panel). Backward steps was observed (indicated by arrows). An energy landscape for the forward and backward steps was determined by statistically analyzing the step movement. (B) Step movement of myosin V. A cartoon of a step movement (left) and step movement in the presence of a load obtained from a laser trap measurement. (C) Step movement of myosin V measured in the absence of a load using single molecule imaging (left) and a histogram of a step size (insert). Changes in the orientation of a head coupled with the step movement determined by simultaneous measurement of the position (top two records) and polarization (bottom two records) of a fluorescent probe rigidly attached to a myosin head. Individual records for two sets of data were measured using two orthogonally polarized excitation lasers (green and red points). (D) Nonprocessive movement (left) and cargo-anchored processive movement of myosin VI (right). In the absence of a bead, single-headed myosin VI undergoes Brownian movement and readily dissociates from the actin filaments (left). When myosin VI is attached to a bead without a trap laser, step movement of 36 nm was monitored.
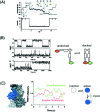
Figure 4. Dynamic structures of biomolecules revealed by single molecule measurements.
(A) Folding processes monitored using force clamp measurement. Polyubiquitin was attached to a probe and constant forces were applied to measure the protein length (top panel) in response to rapid changes in force (bottom panel). When the force was applied, stepwise expansion of the polyprotein was observed due to the unfolding of a unit of ubiquitin. When the force was released suddenly, continuous folding of ubiquitin was observed. (B) Spontaneous structural fluctuations of single hairpin ribozyme molecules. The ribozyme switched its structure between docked and undocked structures, which could be monitored using FRET between two probes on a molecule. Two kinetic states were observed with a long time duration. (C) Dynamic structure of actin. Actin molecules were specifically labeled with two different probes (left) and the donor and acceptor fluorescence showed the FRET varied between two conformational states (middle). The data were interpreted as actin dynamically changes the structure between active and inactive states and preferential binding of myosin to an active state of actin activates myosin motility (right).
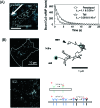
Figure 5. Imaging of activation processes of signaling in living cells at the single molecule level.
(A) Imaging of the binding of cAMP to dictyostelium. Fluorescently labeled cAMP was used for imaging the binding to living cells moving in the presence of a gradient of cAMP. The duration time of the binding measured was plotted for cells moving in two locations. The faster dissociation of cAMP was related to the polarization of the cell for chemotaxis. (B) The imaging of a signal receptor molecule on the cell membrane. Lateral movement of a receptor was measured by tracking a complex of NGF receptors with fluorescently labeled NGF. An activation occurs when the diffusive movement is paused. (C) Imaging of the binding of signaling molecules to a dimer of the receptor. Fluorescently labeled EGF was used for imaging. From the fluorescence intensity, the mechanism of the binding to EGF receptor was determined by fitting to a model (right). The binding affinity was enhanced in the order of the monomer, the first and second binding sites of the dimer.
Similar articles
- Single molecule measurements and molecular motors.
Yanagida T, Iwaki M, Ishii Y. Yanagida T, et al. Philos Trans R Soc Lond B Biol Sci. 2008 Jun 27;363(1500):2123-34. doi: 10.1098/rstb.2008.2265. Philos Trans R Soc Lond B Biol Sci. 2008. PMID: 18339605 Free PMC article. Review. - Advancing Wireframe DNA Nanostructures Using Single-Molecule Fluorescence Microscopy Techniques.
Platnich CM, Hariri AA, Sleiman HF, Cosa G. Platnich CM, et al. Acc Chem Res. 2019 Nov 19;52(11):3199-3210. doi: 10.1021/acs.accounts.9b00424. Epub 2019 Nov 1. Acc Chem Res. 2019. PMID: 31675207 Review. - Single-Molecule Electrical Detection: A Promising Route toward the Fundamental Limits of Chemistry and Life Science.
Li Y, Yang C, Guo X. Li Y, et al. Acc Chem Res. 2020 Jan 21;53(1):159-169. doi: 10.1021/acs.accounts.9b00347. Epub 2019 Sep 23. Acc Chem Res. 2020. PMID: 31545589 - Exploring Structures and Dynamics of Molecular Assemblies: Ultrafast Time-Resolved Electron Diffraction Measurements.
Hada M, Nishina Y, Kato T. Hada M, et al. Acc Chem Res. 2021 Feb 2;54(3):731-743. doi: 10.1021/acs.accounts.0c00576. Epub 2020 Dec 15. Acc Chem Res. 2021. PMID: 33319986 - Biological Nanopores: Confined Spaces for Electrochemical Single-Molecule Analysis.
Cao C, Long YT. Cao C, et al. Acc Chem Res. 2018 Feb 20;51(2):331-341. doi: 10.1021/acs.accounts.7b00143. Epub 2018 Jan 24. Acc Chem Res. 2018. PMID: 29364650
Cited by
- Autonomy and robustness of translocation through the nuclear pore complex: a single-molecule study.
Dange T, Grünwald D, Grünwald A, Peters R, Kubitscheck U. Dange T, et al. J Cell Biol. 2008 Oct 6;183(1):77-86. doi: 10.1083/jcb.200806173. Epub 2008 Sep 29. J Cell Biol. 2008. PMID: 18824568 Free PMC article. - Measuring molecular motor forces in vivo: implications for tug-of-war models of bidirectional transport.
Leidel C, Longoria RA, Gutierrez FM, Shubeita GT. Leidel C, et al. Biophys J. 2012 Aug 8;103(3):492-500. doi: 10.1016/j.bpj.2012.06.038. Biophys J. 2012. PMID: 22947865 Free PMC article.
References
- Amos, W B, and White, J G (2003). “How the confocal laser scanning microscope entered biological research.” Biol. Cell BCELDF 95, 335–342. - PubMed
- Arai, Y, Iwane, A H, Wazawa, T, Yokota, H, Ishii, Y, Kataoka, T, and Yanagida, T (2006). “Dynamic polymorphism of Ras observed by single molecule FRET is the basis for molecular recognition.” Biochem. Biophys. Res. Commun. BBRCA9 343, 809–815. - PubMed
LinkOut - more resources
Full Text Sources
Research Materials


