Fluorescence in situ hybridization study shows association of PTEN deletion with ERG rearrangement during prostate cancer progression - PubMed (original) (raw)
Fluorescence in situ hybridization study shows association of PTEN deletion with ERG rearrangement during prostate cancer progression
Bo Han et al. Mod Pathol. 2009 Aug.
Abstract
The link between ERG rearrangement and PTEN (phosphatase and tensin homolog deleted on chromosome 10) deletion is unclear in prostate cancer progression. Using fluorescence in situ hybridization, we systematically validated the frequency and distribution of ERG and PTEN aberrations in a cohort of 73 benign prostate tissues, 59 high-grade prostatic intraepithelial neoplasia (HGPIN) foci, 281 localized prostate cancer and 47 androgen-independent metastatic prostate cancer patients. Overall, ERG rearrangement was present in 15% (5/33) of HGPIN, 45% (121/267) of localized cancers and 35% (15/43) of metastases. By contrast, PTEN deletion was identified in 9% (3/33) of HGPIN, 17% (42/251) of localized cancers and 54% (22/41) of metastases, of which 0%, 40% (17/42) and 45% (10/22) were homozygous, respectively. Concomitance of ERG rearrangement and PTEN deletion was observed in a subset of HGPIN. Significantly, association between PTEN deletion and ERG rearrangement was present both in localized cancers (P=0.0008) and metastases (P=0.02). Further, immunohistochemistry revealed significant correlation of decreased PTEN protein expression with PTEN genomic deletion both in localized and metastatic cancer. Of note, ERG aberration, but not PTEN deletion, was consistently identical both in localized cancer and adjacent HGPIN. Similarly, whereas all metastases (41/41, 100%) shared the same ERG status across multiple sites from the same patient, 5% (2/41) of cases showed discordance for PTEN deletion status across multiple sites. Collectively, our data support PTEN deletion as a late genetic event in human prostate cancer, presumably a 'second hit' after ERG rearrangement. PTEN deletion and ERG rearrangement may cooperate, but contribute at different stages, in prostate cancer progression.
Conflict of interest statement
Disclosure: The University of Michigan has filed a patent on ETS gene rearrangements in prostate cancer, on which R.M., S.A.T., and A.M.C. are co-inventors, and the diagnostic field of use has been licensed to Gen-Probe Incorporated. Gen-Probe has not played a role in the design and conduct of the study, nor in the collection, analysis, or interpretation of the data, and no involvement in the preparation, review, or approval of the manuscript. A.M.C. serves as a consultant to Gen-Probe Inc.
Figures
Figure 1. FISH probe design and representative ERG aberrations and PTEN deletions detected in prostate cancer
A, Schematic of BACs located 5′ and 3′ to ERG and locus/control for PTEN used as probes for interphase FISH. Chromosomal coordinates are from the March 2006 build of the human genome using the UCSC Genome Browser. BACs are indicated as numbered rectangles, with the number identifying the BAC as described below and the color indicating the probe color in the accompanying images. Genes are shown with the direction of transcription indicated by the arrowhead and exons indicated by bars. B, B1-B2, FISH was performed using BACs as indicated with the corresponding fluorescent label on formalin-fixed paraffin-embedded tissue sections for break-apart FISH of the ERG gene. Green and red arrows showed individual signals, whereas yellow signals were indicated as colocalized probes. B 1, ERG rearrangement positive (with deletion) case showed loss of one red labeled probe 5′ to ERG. B2, ERG rearrangement positive (translocation) case showed one pair of split 5′ and 3′ signals. B3-B4, Representative images of hemizygous and homozygous PTEN deletion in prostate cancer. B3, Representative case with PTEN hemizygous deletion showed one red signals (10q23/PTEN locus) and pairs of green signals (10q11.1) in tumor cells. B4, Representative case with PTEN homozygous deletion showed absence of red signals (10q23/PTEN locus) but retained pairs of green signals (PTEN control). For all assays, at least 50 cancer cell nuclei were evaluated. C, Frequency of PTEN deletion and ERG rearrangement of benign tissues, HGPIN, localized and metastatic prostate cancers is indicated. Color legend signifies respective aberrations.
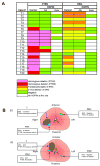
Figure 2. Genomic aberrations of ERG and PTEN in HGPIN
A, Matrix representation of ERG and PTEN genomic aberrations in selected localized prostate cancer patients with paired HGPIN (Adj: HGPIN adjacent to cancer; Away: HGPIN away from cancer) assessed by FISH. Patient case numbers are shown on the left of the matrix map. Each column represents one case and each row represents FISH evaluation for aberrations of ERG or PTEN. Color legend signifies respective aberrations or availability. B, Representative reconstructed maps of the prostectomy sections in case T9 (B1) and T6 (B2). Tumor is represented as T; HGPINadj and HGPINaway are represented as PIN1 and PIN2, respectively. A summary of genomic aberrations of ERG and PTEN for each of these foci is presented in the boxes.
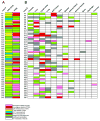
Figure 3. Genomic aberrations of ERG and PTEN in androgen-independent metastatic prostate cancer
A, Matrix representation of the genomic aberrations of ERG and PTEN in metastatic prostate cancers. Patient case numbers are shown on the left of the map. Each column represents one case and each row represents FISH evaluation for ERG or PTEN aberration. Rearrangements of ETV1 and ETV4 in this cohort that were previously published are indicated. B, Matrix representation of PTEN deletion status of the metastatic sites and residual tumor in the prostate (when present) as evaluated in this cohort. Patient case numbers are shown on the left of the map. Each column represents one case and each row represents FISH evaluation for PTEN deletion at each organ site. Color legend signifies respective aberrations or availability.
Figure 4. PTEN expression in prostate cancer by immunohistochemistry
A, Representative case of prostate cancer exhibits positive staining for PTEN graded as 2 (greater than or equivalent to normal adjacent tissues in the same section) (A1, H&E stained section. A2, immunohistochemical staining). Original magnification, 200 X. B, Representative case of prostate cancer exhibits weak staining for PTEN graded as 1 (B1, H&E staining. B2, immunohistochemical staining). C, Representative case of prostate cancer exhibits absence staining for PTEN graded as 0. (C1, H&E staining. C2, immunohistochemical staining). Original magnification, 200 X.
Similar articles
- PTEN genomic deletion is an early event associated with ERG gene rearrangements in prostate cancer.
Bismar TA, Yoshimoto M, Vollmer RT, Duan Q, Firszt M, Corcos J, Squire JA. Bismar TA, et al. BJU Int. 2011 Feb;107(3):477-85. doi: 10.1111/j.1464-410X.2010.09470.x. BJU Int. 2011. PMID: 20590547 - Molecular evidence that invasive adenocarcinoma can mimic prostatic intraepithelial neoplasia (PIN) and intraductal carcinoma through retrograde glandular colonization.
Haffner MC, Weier C, Xu MM, Vaghasia A, Gürel B, Gümüşkaya B, Esopi DM, Fedor H, Tan HL, Kulac I, Hicks J, Isaacs WB, Lotan TL, Nelson WG, Yegnasubramanian S, De Marzo AM. Haffner MC, et al. J Pathol. 2016 Jan;238(1):31-41. doi: 10.1002/path.4628. Epub 2015 Oct 14. J Pathol. 2016. PMID: 26331372 Free PMC article. - Heterogeneity and chronology of PTEN deletion and ERG fusion in prostate cancer.
Krohn A, Freudenthaler F, Harasimowicz S, Kluth M, Fuchs S, Burkhardt L, Stahl P, C Tsourlakis M, Bauer M, Tennstedt P, Graefen M, Steurer S, Sirma H, Sauter G, Schlomm T, Simon R, Minner S. Krohn A, et al. Mod Pathol. 2014 Dec;27(12):1612-20. doi: 10.1038/modpathol.2014.70. Epub 2014 Apr 25. Mod Pathol. 2014. PMID: 24762546 - The impact of PTEN deletion and ERG rearrangement on recurrence after treatment for prostate cancer: a systematic review and meta-analysis.
Liu R, Zhou J, Xia S, Li T. Liu R, et al. Clin Transl Oncol. 2020 May;22(5):694-702. doi: 10.1007/s12094-019-02170-3. Epub 2019 Jul 29. Clin Transl Oncol. 2020. PMID: 31359337 - Examining the Association between ERG/PTEN Expression and Biochemical Recurrence in Prostate Cancer: A Comprehensive Meta-Analysis.
Zhu W, Chen W. Zhu W, et al. Arch Esp Urol. 2025 Jan;78(1):25-36. doi: 10.56434/j.arch.esp.urol.20257801.4. Arch Esp Urol. 2025. PMID: 39943631
Cited by
- Cytoplasmic PTEN protein loss distinguishes intraductal carcinoma of the prostate from high-grade prostatic intraepithelial neoplasia.
Lotan TL, Gumuskaya B, Rahimi H, Hicks JL, Iwata T, Robinson BD, Epstein JI, De Marzo AM. Lotan TL, et al. Mod Pathol. 2013 Apr;26(4):587-603. doi: 10.1038/modpathol.2012.201. Epub 2012 Dec 7. Mod Pathol. 2013. PMID: 23222491 Free PMC article. - ERG rearrangement in local recurrences compared to distant metastases of castration-resistant prostate cancer.
Scheble VJ, Scharf G, Braun M, Ruiz C, Stürm S, Petersen K, Beschorner R, Bachmann A, Zellweger T, Fend F, Kristiansen G, Bubendorf L, Wernert N, Adler D, Perner S. Scheble VJ, et al. Virchows Arch. 2012 Aug;461(2):157-62. doi: 10.1007/s00428-012-1270-7. Epub 2012 Jul 6. Virchows Arch. 2012. PMID: 22767266 - PTEN loss and ERG protein expression are infrequent in prostatic ductal adenocarcinomas and concurrent acinar carcinomas.
Morais CL, Herawi M, Toubaji A, Albadine R, Hicks J, Netto GJ, De Marzo AM, Epstein JI, Lotan TL. Morais CL, et al. Prostate. 2015 Oct;75(14):1610-9. doi: 10.1002/pros.23042. Epub 2015 Jul 14. Prostate. 2015. PMID: 26178158 Free PMC article. - Proteomic and transcriptomic profiling of Pten gene-knockout mouse model of prostate cancer.
Zhang J, Kim S, Li L, Kemp CJ, Jiang C, Lü J. Zhang J, et al. Prostate. 2020 May;80(7):588-605. doi: 10.1002/pros.23972. Epub 2020 Mar 12. Prostate. 2020. PMID: 32162714 Free PMC article. - Clinical implications of PTEN loss in prostate cancer.
Jamaspishvili T, Berman DM, Ross AE, Scher HI, De Marzo AM, Squire JA, Lotan TL. Jamaspishvili T, et al. Nat Rev Urol. 2018 Apr;15(4):222-234. doi: 10.1038/nrurol.2018.9. Epub 2018 Feb 20. Nat Rev Urol. 2018. PMID: 29460925 Free PMC article. Review.
References
- Jemal A, Siegel R, Ward E, Murray T, Xu J, Thun MJ. Cancer statistics, 2007. CA Cancer J Clin. 2007;57:43–66. - PubMed
- Abate-Shen C, Shen MM. Molecular genetics of prostate cancer. Genes Dev. 2000;14:2410–34. - PubMed
- Tomlins SA, Rhodes DR, Perner S, et al. Recurrent fusion of TMPRSS2 and ETS transcription factor genes in prostate cancer. Science. 2005;310:644–8. - PubMed
- Tomlins SA, Mehra R, Rhodes DR, et al. TMPRSS2:ETV4 gene fusions define a third molecular subtype of prostate cancer. Cancer Res. 2006;66:3396–400. - PubMed
- Helgeson BE, Tomlins SA, Shah N, et al. Characterization of TMPRSS2:ETV5 and SLC45A3:ETV5 gene fusions in prostate cancer. Cancer Res. 2008;68:73–80. - PubMed
Publication types
MeSH terms
Substances
Grants and funding
- R01 CA132874/CA/NCI NIH HHS/United States
- R01 CA102872/CA/NCI NIH HHS/United States
- P50CA69568/CA/NCI NIH HHS/United States
- UO1 CA111275-01/CA/NCI NIH HHS/United States
- P50 CA069568/CA/NCI NIH HHS/United States
- U01 CA111275/CA/NCI NIH HHS/United States
LinkOut - more resources
Full Text Sources
Other Literature Sources
Medical
Molecular Biology Databases
Research Materials


