Mechanisms that specify promoter nucleosome location and identity - PubMed (original) (raw)
Mechanisms that specify promoter nucleosome location and identity
Paul D Hartley et al. Cell. 2009.
Abstract
The chromatin architecture of eukaryotic gene promoters is generally characterized by a nucleosome-free region (NFR) flanked by at least one H2A.Z variant nucleosome. Computational predictions of nucleosome positions based on thermodynamic properties of DNA-histone interactions have met with limited success. Here we show that the action of the essential RSC remodeling complex in S. cerevisiae helps explain the discrepancy between theory and experiment. In RSC-depleted cells, NFRs shrink such that the average positions of flanking nucleosomes move toward predicted sites. Nucleosome positioning at distinct subsets of promoters additionally requires the essential Myb family proteins Abf1 and Reb1, whose binding sites are enriched in NFRs. In contrast, H2A.Z deposition is dispensable for nucleosome positioning. By regulating H2A.Z deposition using a steroid-inducible protein splicing strategy, we show that NFR establishment is necessary for H2A.Z deposition. These studies suggest an ordered pathway for the assembly of promoter chromatin architecture.
Figures
Figure 1. Models and Tools
A. Diagram of the Reb1:dT7 signal used in this study. Circles indicate nucleosomes. Yellow circle indicates H2A.Z variant nucleosome. B. Models for relationships between NFR formation and H2A.Z deposition C. Conditional degron alleles of ABF1, REB1 and STH1 display protein depeletion under degron-inducing conditions. Strains were shifted to YPA media containing 2% galactose for the indicated times and analyzed by immunoblotting with anti-HA or anti-Abf1 antibodies. Ponceau staining of blots demonstrated equal protein loading (Fig. S1) D. Growth of degron strains under noninducing and inducing conditions. Shown are serial dilutions of strains plated on the indicated media. Plates were photographed after 2 days of incubation.
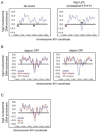
Figure 2. Tiling array analysis of nucleosome positions in the PRM1 ORF containing the Reb1:dT7 insertion
A. Analysis of the effect of Reb1:dT7 sequence insertion on nucleosome positioning. Shown are line traces of a moving average of mononucleosome/genomic probe signals across the PRM1 gene with and without the indicated sequence insertion. Triangles indicate the insertion site. B. Analysis of effects of Reb1 and Sth1 depletion on NFR formation mediated by Reb1:dT7. Indicated strains containing the Reb1:dT7 insertion in the PRM1 gene were analyzed as described in A. C. Analysis of effects of _htz1_Δ and _swr1_Δ mutations on NFR formation mediated by Reb1:dT7. Indicated strains containing the Reb1:dT7 insertion in the PRM1 gene were analyzed as described in A.
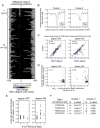
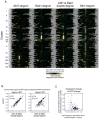
Figure 3. Chromosome-wide tiling array analysis of nucleosome positions in cells depleted of Reb1
A. Difference map analysis of effects of Reb1 depletion on nucleosome positions. Map represents nucleosome positioning data from a control strain lacking the Reb1-degron subtracted from a strain with the Reb1-degron. See Experimental Procedures for further details. Nucleosome positioning data 1kb upstream and downstream of the ATG of 150 genes are shown and orientated such that the direction of transcription is to the right. Asterisks indicate center of the +1 nucleosome downstream of the NFR in the control strain. The x-axis represents the distance (in bp) from the center. Data are organized into two clusters using the k-means method. B. Line traces of average nucleosome positions of the two clusters shown in A The indicated strains were grown under degron-inducing conditions. C. Scatter plots of the lowest probe signal in NFRs. Points indicate the lowest probe signal in the NFR for a locus in control versus degron strains grown under the indicated conditions. D. Correlation between Reb1 binding and changes in nucleosomal enrichment at NFRs at promoters. The significance values (log10 p-value) of Reb1 binding at promoters (Harbison, et al. 2004) are compared against the highest fold changes of nucleosome positioning signals at the associated NFR. E. Correlation between Reb1 consensus sites in promoters and the highest fold change of nucleosome enrichment at the associated NFR under the indicated promoters. F. Enrichment of Reb1 sites in clusters. Shown are the p-values (hypergeometric testing) of the significance of the indicated Reb1 motifs in the indicated clusters.
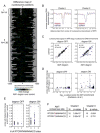
Figure 4. Chromosome-wide tiling array analysis of nucleosome positions in cells depleted of Abf1
A-F. These panels are analogous to those of Figure 3 except that a strain with the Abf1-degron was compared to the same control strain used for analysis of nucleosome positions upon Reb1 depletion.
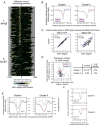
Figure 5. Chromosome-wide tiling array analysis of nucleosome positions in cells depleted of Sth1
A-C. These panels are analogous to those of Figure 3 except that a strain with the Sth1-degron was compared to the same control strain used for analysis of nucleosome positions upon Reb1 depletion. D. Gene expression analysis. Shown is the correlation between mRNA and NFR changes in cells depleted of Sth1. Ploted are the values for genes on chromosome III. Shown on right is the p-values (hypergeometric testing) of the significance of the enrichments in the indicated gene groups using a 1.5-fold cutoff for decreases in mRNA levels. Expression data were not available for all genes in the clusters; hence, Cluster I N=79, Cluster II N=64. E. NPS signature averages. Lines traces of NPS predictions (Ioshikes et al., 2006) for genes in the indicated gene clusters are shown in green. These predictions were smoothed using a 51bp moving average window. Experimental nucleosome position averages (control is blue, Sth1-degron is red) are shown as in panel B. F. Effect of transcription on nucleosome positioning. Shown are the average nucleosome positions for the indicated gene clusters in rpb1-1 strains grown under permissive conditions or for 1 hr under nonpermissive conditions.
Figure 6. Comparison of the roles of Abf1, Reb1, and RSC in nucleosome positioning
A. Clustering analysis of difference maps. Shown are difference maps for the indicated strains including the Abf1-Reb1 “double degron” strain. K-means (K=15) clustering was applied. Line traces of cluster averages are shown in Fig. S14. B. Scatter plots of double degron. Analysis was performed as in Fig. 3C. C. Gene expression analysis. Shown is the correlation between mRNA and NFR changes in cells depleted of both Reb1 and Abf1. The p-value (hypergeometric testing) of the significance of the enrichments in the group of genes (N=20) consisting of those affected in NFR size by Abf1-or Reb1-depletion (Cluster I in Fig. 3 and Cluster I in Fig. 4; corresponding points are colored red in this figure) using a 1.5-fold cutoff for decreases in mRNA levels was 1.2×10⁻⁶. The p value for the remaining, unaffected genes (N=123) was 0.99.
Figure 7. Chromosome-wide tiling array analysis of nucleosome positions in cells defective in H2A.Z nucleosomes
Panels A and B are analogous to Fig. 3B and 3C except that data were derived from cells lacking H2A.Z (_htz1_Δ) or the Swr1 ATPase (_swr1_Δ).
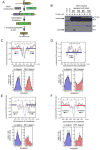
Figure 8. Analysis of H2A.Z deposition requirements using a steroid-regulated intein
A. Schematic of H2A.Z intein constructs. An engineered M. tuberculosis RecA intein controlled by the human estrogen receptor ligand binding domain was placed at a chosen site in HTZ1 gene (encoding H2A.Z). The HTZ1 promoter was replaced with the galactose-inducible pGAL1 promoter. Protein splicing would occur in the presence of 4-hydroxytamoxifen (4-HT) and leave a cysteine residue (“scar”) at the splicing junction. B. Splicing of the H2A.Z intein construct occurs with an allele that replaces Ala46 with the intein construct. The 4-HT-regulated intein was inserted in place of four different residues in H2A.Z, and these constructs each were placed on a 2μ plasmid under the control of a pGAL1 promoter and transformed into a htz1Δ strain. Strains were grown to mid-log phase in the presence of 2% galactose and, when indicated, 10 μM 4-HT. Shown is a Western using polyclonal antibody specific to the C-terminus of H2A.Z. A strain with a chromosomal-based, wild-type copy of HTZ1 and a htz1Δ strain are included as controls. C-F: Analysis of H2A.Z deposition requirements. A strain carrying the Sth1 degron was shifted to degron-inducing conditions which also induces synthesis of unspliced H2A.Z intein construct. After 5 hrs, 4-HT was added to 10μM to induce splicing. Cells were collected after 3 hrs of further incubation, and H2A.Z enrichment at select loci was determined relative to histone H3 enrichment and normalized to a locus in the middle of the large BUD3 ORF. H2A.Z/H3 enrichment profiles under Sth1-depleted conditions were compared against control profiles. The promoters of DCC1/BUD3 are analyzed in C; the _PR_M1 ORF containing the Reb1:dT7 insertion is analyzed in D; the promoter of YCR016W is analyzed in E, and the promoter of YCRO23C is analyzed in F. Top panels of C-F indicate nucleosomal DNA enrichment in various conditions (blue: degron-OFF conditions, red: 5 hrs of degron-ON, green: 8 hrs of degron-ON, with the last 3 hrs in the presence of 4-HT). Bottom panels of C-F represent normalized H2A.Z/H3 enrichment values at the indicated amplicons.
Comment in
- Opening windows to the genome.
Whitehouse I, Tsukiyama T. Whitehouse I, et al. Cell. 2009 May 1;137(3):400-2. doi: 10.1016/j.cell.2009.04.026. Cell. 2009. PMID: 19410536
Similar articles
- Reb1, Cbf1, and Pho4 Bias Histone Sliding and Deposition Away from Their Binding Sites.
Ghassabi Kondalaji S, Bowman GD. Ghassabi Kondalaji S, et al. Mol Cell Biol. 2022 Feb 17;42(2):e0047221. doi: 10.1128/MCB.00472-21. Epub 2021 Dec 13. Mol Cell Biol. 2022. PMID: 34898278 Free PMC article. - Chromatin remodelers clear nucleosomes from intrinsically unfavorable sites to establish nucleosome-depleted regions at promoters.
Tolkunov D, Zawadzki KA, Singer C, Elfving N, Morozov AV, Broach JR. Tolkunov D, et al. Mol Biol Cell. 2011 Jun 15;22(12):2106-18. doi: 10.1091/mbc.E10-10-0826. Epub 2011 Apr 20. Mol Biol Cell. 2011. PMID: 21508315 Free PMC article. - The chromatin remodelers RSC and ISW1 display functional and chromatin-based promoter antagonism.
Parnell TJ, Schlichter A, Wilson BG, Cairns BR. Parnell TJ, et al. Elife. 2015 Mar 30;4:e06073. doi: 10.7554/eLife.06073. Elife. 2015. PMID: 25821983 Free PMC article. - The specificity of H2A.Z occupancy in the yeast genome and its relationship to transcription.
Iyer VR. Iyer VR. Curr Genet. 2020 Oct;66(5):939-944. doi: 10.1007/s00294-020-01087-7. Epub 2020 Jun 14. Curr Genet. 2020. PMID: 32537667 Review. - Spanning the gap: unraveling RSC dynamics in vivo.
Neumann H, Wilkins BJ. Neumann H, et al. Curr Genet. 2021 Jun;67(3):399-406. doi: 10.1007/s00294-020-01144-1. Epub 2021 Jan 23. Curr Genet. 2021. PMID: 33484328 Free PMC article. Review.
Cited by
- Genome-wide mapping and cryo-EM structural analyses of the overlapping tri-nucleosome composed of hexasome-hexasome-octasome moieties.
Nishimura M, Fujii T, Tanaka H, Maehara K, Morishima K, Shimizu M, Kobayashi Y, Nozawa K, Takizawa Y, Sugiyama M, Ohkawa Y, Kurumizaka H. Nishimura M, et al. Commun Biol. 2024 Jan 8;7(1):61. doi: 10.1038/s42003-023-05694-1. Commun Biol. 2024. PMID: 38191828 Free PMC article. - Intrinsic coupling of lagging-strand synthesis to chromatin assembly.
Smith DJ, Whitehouse I. Smith DJ, et al. Nature. 2012 Mar 14;483(7390):434-8. doi: 10.1038/nature10895. Nature. 2012. PMID: 22419157 Free PMC article. - Sir2 and Reb1 antagonistically regulate nucleosome occupancy in subtelomeric X-elements and repress TERRAs by distinct mechanisms.
Bauer SL, Grochalski TNT, Smialowska A, Åström SU. Bauer SL, et al. PLoS Genet. 2022 Sep 22;18(9):e1010419. doi: 10.1371/journal.pgen.1010419. eCollection 2022 Sep. PLoS Genet. 2022. PMID: 36137093 Free PMC article. - Genome-wide mapping of nucleosome positions in yeast using high-resolution MNase ChIP-Seq.
Wal M, Pugh BF. Wal M, et al. Methods Enzymol. 2012;513:233-50. doi: 10.1016/B978-0-12-391938-0.00010-0. Methods Enzymol. 2012. PMID: 22929772 Free PMC article. - Features of cryptic promoters and their varied reliance on bromodomain-containing factors.
Pattenden SG, Gogol MM, Workman JL. Pattenden SG, et al. PLoS One. 2010 Sep 23;5(9):e12927. doi: 10.1371/journal.pone.0012927. PLoS One. 2010. PMID: 20886085 Free PMC article.
References
- Albert I, Mavrich TN, Tomsho LP, Qi J, Zanton SJ, Schuster SC, Pugh BF. Translational and rotational settings of H2A.Z nucleosomes across the Saccharomyces cerevisiae genome. Nature. 2007;446:572–576. - PubMed
- Angermayr M, Oechsner U, Bandlow W. Reb1p-dependent DNA bending effects nucleosome positioning and constitutive transcription at the yeast profilin promoter. J Biol Chem. 2003;278:17918–17926. - PubMed
- Barski A, Cuddapah S, Cui K, Roh TY, Schones DE, Wang Z, Wei G, Chepelev I, Zhao K. High-resolution profiling of histone methylations in the human genome. Cell. 2007;129:823–837. - PubMed
- Beinoraviciute-Kellner R, Lipps G, Krauss G. In vitro selection of DNA binding sites for ABF1 protein from Saccharomyces cerevisiae. FEBS Lett. 2005;579:4535–4540. - PubMed
Publication types
MeSH terms
Substances
Grants and funding
- 5R01GM071801/GM/NIGMS NIH HHS/United States
- R01 GM071801/GM/NIGMS NIH HHS/United States
- R01 GM071801-01A1/GM/NIGMS NIH HHS/United States
- R01 GM071801-02/GM/NIGMS NIH HHS/United States
- R01 GM071801-03/GM/NIGMS NIH HHS/United States
- R01 GM071801-02S1/GM/NIGMS NIH HHS/United States
- R01 GM071801-04/GM/NIGMS NIH HHS/United States
- F31 GM083619/GM/NIGMS NIH HHS/United States
- 1F31GM083619/GM/NIGMS NIH HHS/United States
LinkOut - more resources
Full Text Sources
Other Literature Sources
Molecular Biology Databases
Miscellaneous

