Ets1 and Ets2 are required for endothelial cell survival during embryonic angiogenesis - PubMed (original) (raw)
Ets1 and Ets2 are required for endothelial cell survival during embryonic angiogenesis
Guo Wei et al. Blood. 2009.
Abstract
The ras/Raf/Mek/Erk pathway plays a central role in coordinating endothelial cell activities during angiogenesis. Transcription factors Ets1 and Ets2 are targets of ras/Erk signaling pathways that have been implicated in endothelial cell function in vitro, but their precise role in vascular formation and function in vivo remains ill-defined. In this work, mutation of both Ets1 and Ets2 resulted in embryonic lethality at midgestation, with striking defects in vascular branching having been observed. The action of these factors was endothelial cell autonomous as demonstrated using Cre/loxP technology. Analysis of Ets1/Ets2 target genes in isolated embryonic endothelial cells demonstrated down-regulation of Mmp9, Bcl-X(L), and cIAP2 in double mutants versus controls, and chromatin immunoprecipitation revealed that both Ets1 and Ets2 were loaded at target promoters. Consistent with these observations, endothelial cell apoptosis was significantly increased both in vivo and in vitro when both Ets1 and Ets2 were mutated. These results establish essential and overlapping functions for Ets1 and Ets2 in coordinating endothelial cell functions with survival during embryonic angiogenesis.
Figures
Figure 1
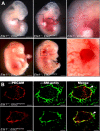
_Ets1_−/−;Ets2A72/A72 mutant embryos have edema and hemorrhage, but blood vessel structure is unaffected. (A) E11.5 (top) and E14.5 (bottom) embryos; control embryo is at the left, mutant embryo is at the right. Boxed areas are enlarged to show region of edema at E11.5 or hemorrhage at E14.5. Bars, 0.5 mm. (B) Cryosections of control (top) and _Ets1_−/−;Ets2 A72/A72 (bottom) embryos were stained with anti–PECAM antibody (green) and anti–smooth muscle α-actin antibody (red). Representative data for E13.5 embryo are shown; a total of 4 embryos were analyzed. Bars, 50 μm
Figure 2
_Ets1_−/−;Ets2A72/A72 embryos have defects in vessel branching and reduced vascular complexity. E10.5 mouse embryos were analyzed by immunohistochemistry with anti–PECAM antibody in whole mount. Controls are in top row (WT), and _Ets1_−/−;Ets2A72/A72 embryos are in lower row (DM). Arrowheads highlight examples of vessel branching in control embryos that are absent in the double-mutant embryos. Bars, 0.25 mm.
Figure 3
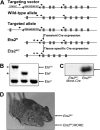
Generation of Ets2 conditional knockout mice. (A) Illustration of targeting strategy. The position of the PCR primers used to distinguish the various alleles are indicated, and asterisks highlight primers used to distinguish Ets2fl and EtsKO alleles. (B) PCR genotyping results for Ets2ko/+, Ets2fl/+, and Ets2+/+ mice, as indicated. Asterisks indicate the PCR products that distinguish the Ets2fl and Ets2ko alleles, and they are coded to the appropriate primer sets represented in panel A. (C) Western blot prepared using embryonic fibroblast extracts derived from MORE;Ets2fl/fl or Ets2fl/fl, as indicated. (D) Waved hair phenotype of adult: Ets2fl/fl;MORE mice (left) versus Ets2fl/fl control littermate (right).
Figure 4
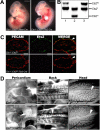
Tie-2-Cre;_Ets1_−/−;Ets2fl/fl embryos have obvious defects in angiogenesis. (A) MORE;_Ets1_−/−;Ets2fl/fl (left) and Tie2-Cre;_Ets1_−/−;Ets2fl/fl (right) E11.5 embryos with edema and hemorrhage. Bars, 0.5 mm. (B) PCR products from DNA extracted from yolk sac of E11.5 Tie2-Cre;_Ets1_−/−;Ets2fl/fl (lane 1), Ets2fl/+ (lane 2), or Ets2fl/KO (lane 3) mice. (C) PECAM (red) and Ets2 (green) antibody staining of cryosections from E11.5 embryos of genotype _Ets1_−/−;Ets2fl/fl (top panels) or Tie2-Cre;_Ets1_−/−;Ets2fl/fl (bottom panels). The third panel is the merged image of PECAM and Ets2 staining. Bars, 50 μm (D) PECAM antibody staining in whole mount of Tie2-Cre;_Ets1_−/−;Ets2fl/fl embryos and _Ets1_−/−;Ets2fl/fl controls, as indicated. Representative data are shown, including pericardium (E11.5, first left panel set), back (E10.5, second middle panel set), and head (E10.5, third right panel set). Arrowheads highlight examples of vessel branching in control embryos that are absent and/or abnormal in the double-mutant embryos. Bars, 0.25 mm.
Figure 5
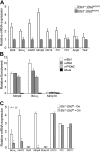
Ets1 and Ets2 directly regulate antiapoptotic genes in vivo and in vitro. (A) Target gene expression in GFP-tagged embryonic endothelial cells isolated by high-speed cell sorting from double-mutant and control mice as indicated. mRNA levels of target genes were standardized to PECAM/CD31 mRNA levels. Cells from 3 individual embryos for each genotyped were analyzed in duplicate experiments. Error bars indicate standard deviation. An asterisk indicates a significant difference between control and double mutant (P < .05) as determined by Student t test. (B) ChIP experiments in cultured aortic ECs, quantified by qPCR. Anti-Ets1, anti-Ets2, and anti–Ets-pThr72 phospho-specific antibodies were used. (C) Analysis of target gene expression by qPCR in cultured aortic ECs with and without Ets1/Ets2 as indicated. ND indicates not detected.
Figure 6
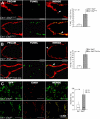
Increased EC apoptosis in Ets1/Ets2 double-mutant mice and in cultured cells deprived of growth factor. (A-B) Anti-PECAM (red) and TUNEL (green) double staining of thin frozen sections from E11.5 embryo of genotype _Ets1_−/−;EtsA72/A72 (A) or _Tie2-Cre Ets1_−/−;Ets2fl/fl (B). The third figure in each panel is the merged image, as indicated. The graphic panel shows the ratio of apoptotic endothelial cells (staining for both PECAM and TUNEL) to total PECAM-positive cells, expressed as percentage of apoptotic cells. At least 300 cells were counted in sections obtained from 2 different E11.5 embryos of genotype _Ets1_−/−;EtsA72/A72 (C) or _Tie2-Cre Ets1_−/−;Ets2fl/fl (D), and appropriate controls as indicated in the figure. Bars, 50 μm. (C) LIVE/DEAD staining of cultured aortic ECs of indicated genotype without Cre (top panels) or with Cre (bottom panels), that is, _Ets1/Ets2_-null condition. Graph at right is quantification of the results. Cells staining red indicate apoptotic/dead cells. Bars, 50 μm. For all panels, error bars indicate SD. * P < .05 (significant difference) between control and double mutant as determined by Student t test.
Comment in
- Functional redundancy of Ets1 and Ets2.
Oettgen P. Oettgen P. Blood. 2009 Jul 30;114(5):934-5. doi: 10.1182/blood-2009-05-221812. Blood. 2009. PMID: 19643995 No abstract available.
Similar articles
- MicroRNA 17-92 cluster mediates ETS1 and ETS2-dependent RAS-oncogenic transformation.
Kabbout M, Dakhlallah D, Sharma S, Bronisz A, Srinivasan R, Piper M, Marsh CB, Ostrowski MC. Kabbout M, et al. PLoS One. 2014 Jun 26;9(6):e100693. doi: 10.1371/journal.pone.0100693. eCollection 2014. PLoS One. 2014. PMID: 24968297 Free PMC article. - Interaction with ZMYND11 mediates opposing roles of Ras-responsive transcription factors ETS1 and ETS2.
Plotnik JP, Hollenhorst PC. Plotnik JP, et al. Nucleic Acids Res. 2017 May 5;45(8):4452-4462. doi: 10.1093/nar/gkx039. Nucleic Acids Res. 2017. PMID: 28119415 Free PMC article. - Transcription factor Ets1, but not the closely related factor Ets2, inhibits antibody-secreting cell differentiation.
John S, Russell L, Chin SS, Luo W, Oshima R, Garrett-Sinha LA. John S, et al. Mol Cell Biol. 2014 Feb;34(3):522-32. doi: 10.1128/MCB.00612-13. Epub 2013 Nov 25. Mol Cell Biol. 2014. PMID: 24277931 Free PMC article. - Mouse models in the study of the Ets family of transcription factors.
Bartel FO, Higuchi T, Spyropoulos DD. Bartel FO, et al. Oncogene. 2000 Dec 18;19(55):6443-54. doi: 10.1038/sj.onc.1204038. Oncogene. 2000. PMID: 11175360 Review. - Ets transcription factors and targets in osteogenesis.
Raouf A, Seth A. Raouf A, et al. Oncogene. 2000 Dec 18;19(55):6455-63. doi: 10.1038/sj.onc.1204037. Oncogene. 2000. PMID: 11175361 Review.
Cited by
- ETS1, a target gene of the EWSR1::FLI1 fusion oncoprotein, regulates the expression of the focal adhesion protein TENSIN3.
Ebegboni VJ, Jones TL, Brownmiller T, Zhao PX, Pehrsson EC, Rajan SS, Caplen NJ. Ebegboni VJ, et al. bioRxiv [Preprint]. 2023 Dec 23:2023.12.21.572864. doi: 10.1101/2023.12.21.572864. bioRxiv. 2023. PMID: 38187702 Free PMC article. Updated. Preprint. - The Evolution of Biomineralization through the Co-Option of Organic Scaffold Forming Networks.
Ben-Tabou de-Leon S. Ben-Tabou de-Leon S. Cells. 2022 Feb 9;11(4):595. doi: 10.3390/cells11040595. Cells. 2022. PMID: 35203246 Free PMC article. Review. - ETS-dependent regulation of a distal Gata4 cardiac enhancer.
Schachterle W, Rojas A, Xu SM, Black BL. Schachterle W, et al. Dev Biol. 2012 Jan 15;361(2):439-49. doi: 10.1016/j.ydbio.2011.10.023. Epub 2011 Oct 26. Dev Biol. 2012. PMID: 22056786 Free PMC article. - Integrative genome analysis of somatic p53 mutant osteosarcomas identifies Ets2-dependent regulation of small nucleolar RNAs by mutant p53 protein.
Pourebrahim R, Zhang Y, Liu B, Gao R, Xiong S, Lin PP, McArthur MJ, Ostrowski MC, Lozano G. Pourebrahim R, et al. Genes Dev. 2017 Sep 15;31(18):1847-1857. doi: 10.1101/gad.304972.117. Epub 2017 Oct 11. Genes Dev. 2017. PMID: 29021240 Free PMC article. - Ets2 Exacerbates Diabetic Retinopathy by Aggravating the Proliferation of Endothelial Cells and Inflammatory Response.
Wang S, Bao N, Li M, Liu D, Tao L. Wang S, et al. Biochem Genet. 2024 Oct 21. doi: 10.1007/s10528-024-10938-8. Online ahead of print. Biochem Genet. 2024. PMID: 39432129
References
- Folkman J. Angiogenesis. Annu Rev Med. 2006;57:1–18. - PubMed
- Zetter BR. Angiogenesis and tumor metastasis. Annu Rev Med. 1998;49:407–424. - PubMed
- Cheresh DA, Stupack DG. Regulation of angiogenesis: apoptotic cues from the ECM. Oncogene. 2008;27:6285–6298. - PubMed
- Hurwitz H, Fehrenbacher L, Novotny W, et al. Bevacizumab plus irinotecan, fluorouracil, and leucovorin for metastatic colorectal cancer. N Engl J Med. 2004;350:2335–2342. - PubMed
- Folkman J. Angiogenesis and apoptosis. Semin Cancer Biol. 2003;13:159–167. - PubMed
Publication types
MeSH terms
Substances
LinkOut - more resources
Full Text Sources
Molecular Biology Databases
Research Materials
Miscellaneous
