Life-span extension in mice by preweaning food restriction and by methionine restriction in middle age - PubMed (original) (raw)
Life-span extension in mice by preweaning food restriction and by methionine restriction in middle age
Liou Sun et al. J Gerontol A Biol Sci Med Sci. 2009 Jul.
Abstract
Life span can be extended in rodents by restricting food availability (caloric restriction [CR]) or by providing food low in methionine (Meth-R). Here, we show that a period of food restriction limited to the first 20 days of life, via a 50% enlargement of litter size, shows extended median and maximal life span relative to mice from normal sized litters and that a Meth-R diet initiated at 12 months of age also significantly increases longevity. Furthermore, mice exposed to a CR diet show changes in liver messenger RNA patterns, in phosphorylation of Erk, Jnk2, and p38 kinases, and in phosphorylation of mammalian target of rapamycin and its substrate 4EBP1, HE-binding protein 1 that are not observed in liver from age-matched Meth-R mice. These results introduce new protocols that can increase maximal life span and suggest that the spectrum of metabolic changes induced by low-calorie and low-methionine diets may differ in instructive ways.
Figures
Figure 1.
Survival curves for mice placed on a methionine-restricted diet at 12 months of age compared with controls. Each symbol represents one mouse. Statistical results are shown for the log-rank test and for a test of the proportion of mice still alive at the 90th percentile of the joint survival distribution.
Figure 2.
Gene expression results for a set of 94 messenger RNAs (mRNAs) evaluated by multiplex reverse transcription–polymerase chain reaction in groups of seven to nine mice. The horizontal axis reports the ratio of expression in liver of methionine-restricted (Meth-R) compared with Meth-C mice. The vertical axis shows the ratio of expression in liver of caloric restriction (CR) compared with ad libitum (AL) control mice. Filled symbols show genes for which a test of false discovery rate showed p < .05 for the comparison of CR with AL mice. Underlined gene names show the three mRNA for which the false discovery statistic reached p < .05 for the comparison between Meth-R and Meth-C mice. Gene names are given for 11 arbitrarily selected genes; a complete listing is included in
Supplementary Table 1
.
Figure 3.
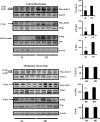
Evaluation of Erk, JNK, and p38 status in liver of caloric restriction (CR) and methionine-restricted (Meth-R) mice. Each group of immunoblots shows a representative experiment involving four ad libitum and four CR mice (top set) or four Meth-C and four Meth-R mice (bottom set), stained (top to bottom) for phosphorylated Erk1/2, total Erk1/2, phosphorylated JNK2, total JNK2, phosphorylated p38, total p38, and actin. The bar graphics at the right show means and _SE_s of the mean for eight mice of each type. Asterisks indicate significance at p < .05 by an unpaired _t_-test for the indicated comparison.
Figure 4.
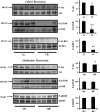
Evaluation of enzymes in the target of rapamycin pathway in liver of caloric restriction (CR) and methionine-restricted (Meth-R) mice. Each group of immunoblots shows a representative experiment involving four ad libitum and four CR mice (top set) or four Meth-C and four Meth-R mice (bottom set), stained (top to bottom) for phosphorylated Akt, total Akt, phosphorylated mammalian target of rapamycin (mTOR), total mTOR, phosphorylated 4EBP1, and total 4EBP1. The bar graphics at the right show means and _SE_s of the mean for eight mice of each type. Asterisks indicate significance at p < .05 (*) or p < .01 (**) by an unpaired _t_-test for the indicated comparison.
Figure 5.
Survival plots for litter enlargement (LE) mice (litters expanded from 8 to 12 pups at birth), PR mice (mothers given a low-protein diet during lactation), and control mice (litters of eight pups, mothers receiving standard diet during lactation). Each symbol represents one mouse. The LE group differs from controls by log-rank test (p = .0007) and by the Wang and Allison test for survival past the 90th percentile (p = .03).
Figure 6.
Body weight curves for male (left) and female (right) mice exposed to differing levels of nutrition during early postnatal development. Each point represents the mean ± SE body weight of 7–26 individuals dependent upon sex and treatment with one exception: only two female control mice were alive at Week 112. For clarity, the inset top panels show body weight curves for mice aged 3–8 weeks.
Similar articles
- Circadian clocks govern calorie restriction-mediated life span extension through BMAL1- and IGF-1-dependent mechanisms.
Patel SA, Chaudhari A, Gupta R, Velingkaar N, Kondratov RV. Patel SA, et al. FASEB J. 2016 Apr;30(4):1634-42. doi: 10.1096/fj.15-282475. Epub 2015 Dec 23. FASEB J. 2016. PMID: 26700733 Free PMC article. - The low-methionine content of vegan diets may make methionine restriction feasible as a life extension strategy.
McCarty MF, Barroso-Aranda J, Contreras F. McCarty MF, et al. Med Hypotheses. 2009 Feb;72(2):125-8. doi: 10.1016/j.mehy.2008.07.044. Epub 2008 Sep 11. Med Hypotheses. 2009. PMID: 18789600 - Reduced growth hormone signaling and methionine restriction: interventions that improve metabolic health and extend life span.
Brown-Borg HM. Brown-Borg HM. Ann N Y Acad Sci. 2016 Jan;1363:40-9. doi: 10.1111/nyas.12971. Epub 2015 Dec 8. Ann N Y Acad Sci. 2016. PMID: 26645136 Free PMC article. Review. - Methionine restriction and life-span control.
Lee BC, Kaya A, Gladyshev VN. Lee BC, et al. Ann N Y Acad Sci. 2016 Jan;1363:116-24. doi: 10.1111/nyas.12973. Epub 2015 Dec 10. Ann N Y Acad Sci. 2016. PMID: 26663138 Free PMC article. Review. - Nutritional control of aging.
Zimmerman JA, Malloy V, Krajcik R, Orentreich N. Zimmerman JA, et al. Exp Gerontol. 2003 Jan-Feb;38(1-2):47-52. doi: 10.1016/s0531-5565(02)00149-3. Exp Gerontol. 2003. PMID: 12543260
Cited by
- Does Methionine Status Influence the Outcome of Selenomethinione Supplementation? A Comparative Study of Metabolic and Selenium Levels in HepG2 Cells.
Hu Y, Chai X, Men J, Rao S, Cong X, Cheng S, Qiao Z. Hu Y, et al. Nutrients. 2022 Sep 8;14(18):3705. doi: 10.3390/nu14183705. Nutrients. 2022. PMID: 36145081 Free PMC article. - Organization of the Mammalian Metabolome according to Organ Function, Lineage Specialization, and Longevity.
Ma S, Yim SH, Lee SG, Kim EB, Lee SR, Chang KT, Buffenstein R, Lewis KN, Park TJ, Miller RA, Clish CB, Gladyshev VN. Ma S, et al. Cell Metab. 2015 Aug 4;22(2):332-43. doi: 10.1016/j.cmet.2015.07.005. Cell Metab. 2015. PMID: 26244935 Free PMC article. - Effects of Weight Loss and Moderate-Protein, High-Fiber Diet Consumption on the Fasted Serum Metabolome of Cats.
Pallotto MR, Oba PM, de Godoy MRC, Pappan KL, Buff PR, Swanson KS. Pallotto MR, et al. Metabolites. 2021 May 18;11(5):324. doi: 10.3390/metabo11050324. Metabolites. 2021. PMID: 34070109 Free PMC article. - The plasma metabolome as a predictor of biological aging in humans.
Johnson LC, Parker K, Aguirre BF, Nemkov TG, D'Alessandro A, Johnson SA, Seals DR, Martens CR. Johnson LC, et al. Geroscience. 2019 Dec;41(6):895-906. doi: 10.1007/s11357-019-00123-w. Epub 2019 Nov 9. Geroscience. 2019. PMID: 31707594 Free PMC article. - Methionine restriction delays aging-related urogenital diseases in male Fischer 344 rats.
Komninou D, Malloy VL, Zimmerman JA, Sinha R, Richie JP Jr. Komninou D, et al. Geroscience. 2020 Feb;42(1):287-297. doi: 10.1007/s11357-019-00129-4. Epub 2019 Nov 14. Geroscience. 2020. PMID: 31728897 Free PMC article.
References
- Weindruch R, Walford RL. The Retardation of Aging and Disease by Dietary Restriction. Springfield, IL: Charles C. Thomas; 1988.
- Orentreich N, Matias JR, DeFelice A, Zimmerman JA. Low methionine ingestion by rats extends lifespan. J Nutr. 1993;123:269–274. - PubMed
- Zimmerman J, Malloy V, Krajcik R, Orentreich N. Nutritional control of aging. Exp Gerontol. 2003;38:47–52. - PubMed
- Brown-Borg HM, Borg KE, Meliska CJ, Bartke A. Dwarf mice and the aging process. Nature. 1996;384:33. - PubMed
- Coschigano KT, Holland AN, Riders ME, List EO, Flyvberg ALLA, Kopchick JJ. Deletion, but not antagonism, of the mouse growth hormone receptor results in severely decreased body weights, insulin and IGF-I levels and increased lifespan. Endocrinology. 2003;174:3799–3810. - PubMed
Publication types
MeSH terms
Substances
Grants and funding
- AG023122/AG/NIA NIH HHS/United States
- P60 AG008808/AG/NIA NIH HHS/United States
- AG024824/AG/NIA NIH HHS/United States
- R01 AG019899/AG/NIA NIH HHS/United States
- U19 AG023122/AG/NIA NIH HHS/United States
LinkOut - more resources
Full Text Sources
Other Literature Sources
Medical
Research Materials
Miscellaneous


