Role of breast regression protein 39 (BRP-39)/chitinase 3-like-1 in Th2 and IL-13-induced tissue responses and apoptosis - PubMed (original) (raw)
. 2009 May 11;206(5):1149-66.
doi: 10.1084/jem.20081271. Epub 2009 May 4.
Dominik Hartl, Gap Ryol Lee, Barbara Koller, Hiroshi Matsuura, Carla A Da Silva, Myung Hyun Sohn, Lauren Cohn, Robert J Homer, Alexander A Kozhich, Alison Humbles, Jennifer Kearley, Anthony Coyle, Geoffrey Chupp, Jennifer Reed, Richard A Flavell, Jack A Elias
Affiliations
- PMID: 19414556
- PMCID: PMC2715037
- DOI: 10.1084/jem.20081271
Role of breast regression protein 39 (BRP-39)/chitinase 3-like-1 in Th2 and IL-13-induced tissue responses and apoptosis
Chun Geun Lee et al. J Exp Med. 2009.
Abstract
Mouse breast regression protein 39 (BRP-39; Chi3l1) and its human homologue YKL-40 are chitinase-like proteins that lack chitinase activity. Although YKL-40 is expressed in exaggerated quantities and correlates with disease activity in asthma and many other disorders, the biological properties of BRP-39/YKL-40 have only been rudimentarily defined. We describe the generation and characterization of BRP-39(-/-) mice, YKL-40 transgenic mice, and mice that lack BRP-39 and produce YKL-40 only in their pulmonary epithelium. Studies of these mice demonstrated that BRP-39(-/-) animals have markedly diminished antigen-induced Th2 responses and that epithelial YKL-40 rescues the Th2 responses in these animals. The ability of interleukin13 to induce tissue inflammation and fibrosis was also markedly diminished in the absence of BRP-39. Mechanistic investigations demonstrated that BRP-39 and YKL-40 play an essential role in antigen sensitization and immunoglobulin E induction, stimulate dendritic cell accumulation and activation, and induce alternative macrophage activation. These proteins also inhibit inflammatory cell apoptosis/cell death while inhibiting Fas expression, activating protein kinase B/AKT, and inducing Faim 3. These studies establish novel regulatory roles for BRP-39/YKL-40 in the initiation and effector phases of Th2 inflammation and remodeling and suggest that these proteins are therapeutic targets in Th2- and macrophage-mediated disorders.
Figures
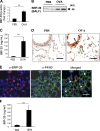
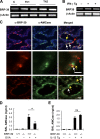
Figure 1.
Regulation of BRP-39 during antigen-induced Th2 inflammation. (A–F) WT BALB/c mice were sensitized with OVA plus alum and challenged with PBS or OVA (A–E) or sensitized with HDM antigen plus alum and challenged with PBS or HDM (F). (A) The levels of BRP-39 mRNA were evaluated by real time RT-PCR. (B and C) BRP-39 accumulation was assessed via Western analysis (B) and ELISA (C) using lung lysate and BAL fluid, respectively. (D) Immunohistochemistry (IHC) was also used to localize the BRP-39 (solid arrow, airway epithelial cell; open arrow, alveolar macrophage). (E) Double-label IHC using BRP-39 and F4/80 antibodies, localized BRP-39, and F4/80-positive macrophages (white arrows, double+ cells). (F) The levels of BRP-39 in BAL fluids from PBS- or HDM-challenged mice, assessed by ELISA. Values in A, C, and F are the mean ± SEM of evaluations in a minimum of five animals and are representative of two separate evaluations. B, D, and E are illustrative of a minimum of three separate experiments. **, P < 0.01. Bars, 25 µm.
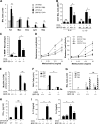
Figure 2.
Antigen-induced responses in BRP-39−/− mice. (A–C) BALB/c WT (+/+) and BRP-39−/− mice were sensitized and challenged with OVA (OVA+) or PBS (OVA−). 24 h later, BAL total (Tot) cell, macrophage (Mac), eosinophil (Eos), lymphocyte (Lym), and neutrophil (Neu) recovery were quantitated (A), IL-4– and IL-13–expressing Th2 cells were assessed (B), and MMR expressing alternatively activated macrophages were quantitated (C). (D) AHR was addressed by comparing the airways resistance and elastance of OVA-sensitized and -challenged WT mice (solid circles and solid lines) and BRP-39−/− mice (solid squares and solid lines), WT mice sensitized with OVA and challenged with PBS (circles and dashed lines), and BRP-39−/− mice sensitized with OVA and challenged with PBS (squares and dashed lines). (E) Levels of Muc5ac in the BAL were quantitated by densitometry after slot blotting and immunodetection. (F) WT (+/+) and BRP-39−/− mice were also sensitized and challenged by HDM extract, and BAL cells were evaluated 1 d after the last challenge. (G and H) In evaluations of Th1 responses, WT (+/+) and BRP-39−/− mice were sensitized with CFA/OVA (CFA/OVA+) or PBS (CFA/OVA−) and challenged by OVA. 24 h after the last challenge, BAL cell recovery (G) and BAL IFN-γ levels (H) were evaluated. (I) ELISA evaluations were also used to quantitate the levels of BAL IL-13 and IL-4 in OVA-induced Th2 responses. The values are the mean ± SEM of evaluations in a minimum of five animals and are representative of at least three independent experiments. MFI, median fluorescence intensity; ns, not significant. *, P < 0.05; **, P < 0.01.
Figure 3.
BRP-39 regulation of antigen sensitization. Splenocytes were isolated from the BALB/c WT and BRP-39−/− mice that were sensitized and challenged by PBS (OVA−) or OVA (OVA+). (A and B) After restimulation with OVA, splenocyte proliferation was assessed by BrdU staining (A), and OVA-specific IgE levels (B) were evaluated by ELISA. (C–E) FACS was used to assess mDC (C) and pDC (D) numbers and mDC expression of CD86, CD40, and CD80 (E) in lungs from WT and BRP-39−/− mice that were or were not sensitized and challenged with OVA. The values are the mean ± SEM of evaluations in a minimum of five animals and are representative of three separate experiments. MFI, median fluorescence intensity; ns, not significant. *, P < 0.05; **, P < 0.01.
Figure 4.
Regulation and roles of BRP-39 in IL-13–induced tissue responses. (A and B) Real-time RT-PCR and Western analysis were used to evaluate the levels of mRNA encoding BRP-39 (A) and BALF BRP-39 protein (B) in lungs from C57BL/6 WT (+/+) and IL-13 Tg mice. (C) The localization of the BRP-39 was evaluated with IHC. Solid arrow, airway epithelium; open arrow, macrophage. (D) Further cellular localization was obtained via double-label IHC using BRP-39 and cell-specific antibodies (CC10, airway epithelial cells; pro-SPC, alveolar type II cells; CD45, leukocytes). Arrows, positive for both antibodies. (E and F) Using WT and IL-13 Tg mice with WT (+/+) and null (−/−) BRP-39 loci, FACS was used to assess BAL CD4+ Th2 cells (E) and histological evaluations were used to evaluate inflammation and airway remodeling (F; left and center are H&E stains [open arrows, peribronchial fibrosis; solid arrow, inflammation] and right are Mallory’s trichrome stains [open arrows, subepithelial fibrosis). (G and H) Total collagen content of the right lung and the levels of BAL total TGF-β1 were quantitated by Sircol collagen assay (G) and ELISA (H), respectively. The values in A, E, G, and H are the mean ± SEM of evaluations in a minimum of four animals and are representative of three separate evaluations. B, C, D, and F are illustrative of a minimum of three separate experiments. MFI, median fluorescence intensity. *, P < 0.05; **, P < 0.01. Bars, 25 µm.
Figure 5.
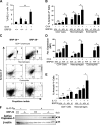
Roles of BRP-39 in inflammatory cell apoptosis/cell death in vivo. BALB/c WT (+/+) and BRP-39−/− mice were sensitized and challenged with OVA (OVA+) or PBS (OVA−). (A–C) Apoptosis was evaluated using TUNEL stains (A) and FACS evaluations to evaluate the expression of annexin V (B), and annexin V and the uptake of PI (C). (D) The expression of Fas was also evaluated by flow cytometry. (E and F) In the C57BL/6 WT and IL-13 Tg mice with WT and null BRP-39 loci, annexin V+ CD4 T cells and macrophages (E) and active caspase 3 expression (F) were evaluated by FACS and Western blot analysis, respectively. The values in A, B, D, and E are the mean ± SEM of evaluations in a minimum of five animals and are representative of at least three separate evaluations. C and F are representative of five and two experiments, respectively. MFI, median fluorescence intensity. *, P < 0.05; **, P < 0.01.
Figure 6.
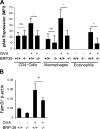
Roles of BRP-39 in AKT phosphorylation and Faim 3 expression. BALB/c WT (+/+) and BRP-39−/− mice were sensitized and challenged with OVA (OVA+) or PBS (OVA−). (A and B) FACS and real-time RT-PCR were used to evaluate the expression of phosphorylated Akt (A) and the levels of mRNA encoding Faim 3 (B), respectively. The values in A and B are the mean ± SEM of evaluations in a minimum of five animals and are representative of at least two separate evaluations. MFI, median fluorescence intensity. *, P < 0.05.
Figure 7.
Roles of BRP-39 in splenocyte and macrophage apoptosis/cell death and macrophage activation in vitro. (A) Splenocytes from C57BL/6 WT mice were incubated in the presence or absence of 100 ng/ml TNF-α or 100 ng/ml FasL in the presence or absence of 10 µg/ml rBRP-39. The levels of annexin V staining, intracellular activated caspase 3, Fas expression, and AKT phosphorylation were evaluated. (B) Peritoneal macrophages were elicited from WT (+/+) and BRP-39−/− mice and incubated in the presence or absence of the noted doses of rBRP-39. Annexin V staining, Fas expression, and the levels of phosphorylated AKT were evaluated. *, P < 0.05. (C) Peritoneal and alveolar macrophages were obtained from WT mice, incubated with 5 ng/ml rBRP-39 or IL-4 for 48 h, and arginase 1 activity and the expression of MMR were assessed. The values are the mean ± SEM of evaluations in a minimum of five animals and are representative of at least three separate evaluations. MFI, median fluorescence intensity. *, P < 0.05.
Figure 8.
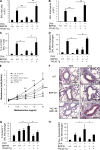
Effects of Tg YKL-40 on OVA-induced Th2 responses in C57BL/6 BRP-39−/− mice. 8-wk-old WT mice, BRP-39−/− mice, and mice that do not make BRP-39 but produce YKL-40 in their lung epithelial cells (BRP-39−/−/YKL-40+) were sensitized and challenged as described in Materials and methods. (A–D) Mice were sacrificed 24 h after the last challenge, and BAL total cell (A), eosinophil (B), IL4+CD4+ Th2 cells (C), and MMR expression (D) were evaluated. (E) AHR was also addressed by comparing the airway resistance of OVA-sensitized and -challenged WT mice (open circles), BRP-39−/− mice (open squares), YKL40 Tg mice (solid circles), BRP-39−/−/YKL-40+ mice (solid triangles), and WT mice sensitized with OVA and challenged with PBS (solid squares). *, P < 0.05 vs. WT/PBS; **, P < 0.01 vs. WT/PBS; ***, P < 0.01 vs. BRP-39−/−/OVA. (F) Mucus metaplasia was evaluated with D-PAS staining. (G and H) FACS analysis was used to assess alveolar macrophage annexin V+ (G) and Fas (H) expression. The values in A–E, G, and H are the mean ± SEM of evaluations in a minimum of five animals and are representative of two separate experiments. F is representative of five similar evaluations. MFI, median fluorescence intensity. *, P < 0.05; **, P < 0.01. Bars, 50 µm.
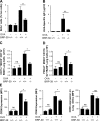
Figure 9.
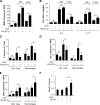
Effects of Tg YKL-40. In A and B, YKL-40 Tg mice (YKL40 Tg+) and Tg negative (−) littermate controls were placed on dox, OVA sensitization and challenge were undertaken, and evaluations were performed 24 h and 2 wk later. (A and B) The levels of MMR expression (A) and the accumulation of IL-4– and IL-13–producing cells (B) in the BAL were evaluated. (C–E) YKL-40 Tg mice (YKL40 Tg+) and Tg negative (−) littermate controls were placed on dox, OVA sensitization and challenge were undertaken, and evaluations were performed 2 wk later. The expression of CD4 cell and macrophage annexin V (C), Fas (D), and the levels of activated Akt (E) were evaluated. *, P < 0.05. (F) The levels of Faim 3 mRNA were evaluated 24 h after the last challenge by real-time RT-PCR. The values are the mean ± SEM of evaluations in a minimum of five animals and are representative of two separate experiments. MFI, median fluorescence intensity. *, P < 0.05.
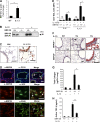
Figure 10.
Comparisons of BRP-39 and AMCase. (A) The levels of mRNA encoding BRP-39 in mice that received antigen-specific in vitro–polarized Th1 or Th2 cells and were challenged with antigen (c, control). (B) BRP-39 expression was evaluated by RT-PCR in IFN-γ Tg mice and controls (−). (C) AMCase and BRP-39 expression were localized in the lungs of 2-mo-old IL-13 Tg mice by double-label IHC (white arrows, colocalized; yellow arrows, AMCase; red arrows, BRP-39). (D and E) The levels of BAL AMCase were assessed in OVA-plus-alum–sensitized and OVA-challenged mice (D) and IL-13 Tg mice with WT and null BRP-39 loci (E). The values in D and E are the mean ± SEM of evaluations in a minimum of five animals and are representative of two separate evaluations. *, P < 0.05. Bars, 25 µm.
Similar articles
- Chitinase 3-like 1 drives allergic skin inflammation via Th2 immunity and M2 macrophage activation.
Kwak EJ, Hong JY, Kim MN, Kim SY, Kim SH, Park CO, Kim KW, Lee CG, Elias JA, Jee HM, Sohn MH. Kwak EJ, et al. Clin Exp Allergy. 2019 Nov;49(11):1464-1474. doi: 10.1111/cea.13478. Epub 2019 Aug 28. Clin Exp Allergy. 2019. PMID: 31397016 Clinical Trial. - The chitinase-like proteins breast regression protein-39 and YKL-40 regulate hyperoxia-induced acute lung injury.
Sohn MH, Kang MJ, Matsuura H, Bhandari V, Chen NY, Lee CG, Elias JA. Sohn MH, et al. Am J Respir Crit Care Med. 2010 Oct 1;182(7):918-28. doi: 10.1164/rccm.200912-1793OC. Epub 2010 Jun 17. Am J Respir Crit Care Med. 2010. PMID: 20558631 Free PMC article. - Role of breast regression protein-39 in the pathogenesis of cigarette smoke-induced inflammation and emphysema.
Matsuura H, Hartl D, Kang MJ, Dela Cruz CS, Koller B, Chupp GL, Homer RJ, Zhou Y, Cho WK, Elias JA, Lee CG. Matsuura H, et al. Am J Respir Cell Mol Biol. 2011 Jun;44(6):777-86. doi: 10.1165/rcmb.2010-0081OC. Epub 2010 Jul 23. Am J Respir Cell Mol Biol. 2011. PMID: 20656949 Free PMC article. - Role of chitin and chitinase/chitinase-like proteins in inflammation, tissue remodeling, and injury.
Lee CG, Da Silva CA, Dela Cruz CS, Ahangari F, Ma B, Kang MJ, He CH, Takyar S, Elias JA. Lee CG, et al. Annu Rev Physiol. 2011;73:479-501. doi: 10.1146/annurev-physiol-012110-142250. Annu Rev Physiol. 2011. PMID: 21054166 Free PMC article. Review. - The chitinase and chitinase-like proteins: a review of genetic and functional studies in asthma and immune-mediated diseases.
Ober C, Chupp GL. Ober C, et al. Curr Opin Allergy Clin Immunol. 2009 Oct;9(5):401-8. doi: 10.1097/ACI.0b013e3283306533. Curr Opin Allergy Clin Immunol. 2009. PMID: 19644363 Free PMC article. Review.
Cited by
- Breast regression protein-39 (BRP-39) promotes dendritic cell maturation in vitro and enhances Th2 inflammation in murine model of asthma.
Xu Q, Chai SJ, Qian YY, Zhang M, Wang K. Xu Q, et al. Acta Pharmacol Sin. 2012 Dec;33(12):1525-32. doi: 10.1038/aps.2012.154. Epub 2012 Nov 26. Acta Pharmacol Sin. 2012. PMID: 23178461 Free PMC article. - Stat3 downstream gene product chitinase 3-like 1 is a potential biomarker of inflammation-induced lung cancer in multiple mouse lung tumor models and humans.
Yan C, Ding X, Wu L, Yu M, Qu P, Du H. Yan C, et al. PLoS One. 2013 Apr 22;8(4):e61984. doi: 10.1371/journal.pone.0061984. Print 2013. PLoS One. 2013. PMID: 23613996 Free PMC article. - Diagnostic and Prognostic Impact of Circulating YKL-40, IL-6, and CA 19.9 in Patients with Pancreatic Cancer.
Schultz NA, Christensen IJ, Werner J, Giese N, Jensen BV, Larsen O, Bjerregaard JK, Pfeiffer P, Calatayud D, Nielsen SE, Yilmaz MK, Holländer NH, Wøjdemann M, Bojesen SE, Nielsen KR, Johansen JS. Schultz NA, et al. PLoS One. 2013 Jun 26;8(6):e67059. doi: 10.1371/journal.pone.0067059. Print 2013. PLoS One. 2013. PMID: 23840582 Free PMC article. - Human YKL-39 is a pseudo-chitinase with retained chitooligosaccharide-binding properties.
Schimpl M, Rush CL, Betou M, Eggleston IM, Recklies AD, van Aalten DM. Schimpl M, et al. Biochem J. 2012 Aug 15;446(1):149-57. doi: 10.1042/BJ20120377. Biochem J. 2012. PMID: 22742450 Free PMC article. - Chitinase 3-like-1 promotes Streptococcus pneumoniae killing and augments host tolerance to lung antibacterial responses.
Dela Cruz CS, Liu W, He CH, Jacoby A, Gornitzky A, Ma B, Flavell R, Lee CG, Elias JA. Dela Cruz CS, et al. Cell Host Microbe. 2012 Jul 19;12(1):34-46. doi: 10.1016/j.chom.2012.05.017. Cell Host Microbe. 2012. PMID: 22817986 Free PMC article.
References
- Boot R.G., Blommaart E.F., Swart E., Ghauharali-van der Vlugt K., Bijl N., Moe C., Place A., Aerts J.M. 2001. Identification of a novel acidic mammalian chitinase distinct from chitotriosidase.J. Biol. Chem. 276:6770–6778 - PubMed
- Chupp G.L., Lee C.G., Jarjour N., Shim Y.M., Holm C.T., He S., Dziura J.D., Reed J., Coyle A.J., Kiener P., et al. 2007. A chitinase-like protein in the lung and circulation of patients with severe asthma.N. Engl. J. Med. 357:2016–2027 - PubMed
- Kawada M., Hachiya Y., Arihiro A., Mizoguchi E. 2007. Role of mammalian chitinases in inflammatory conditions.Keio J. Med. 56:21–27 - PubMed
- Zhu Z., Zheng T., Homer R.J., Kim Y.K., Chen N.Y., Cohn L., Hamid Q., Elias J.A. 2004. Acidic mammalian chitinase in asthmatic Th2 inflammation and IL-13 pathway activation.Science. 304:1678–1682 - PubMed
- Shahabuddin M., Kaslow D.C. 1994. Plasmodium: parasite chitinase and its role in malaria transmission.Exp. Parasitol. 79:85–88 - PubMed
Publication types
MeSH terms
Substances
Grants and funding
- R01 HL081639/HL/NHLBI NIH HHS/United States
- R01-HL-064242/HL/NHLBI NIH HHS/United States
- R01 HL064242/HL/NHLBI NIH HHS/United States
- R01 HL084225/HL/NHLBI NIH HHS/United States
- R01-HL-084225/HL/NHLBI NIH HHS/United States
- R01-HL-081639/HL/NHLBI NIH HHS/United States
LinkOut - more resources
Full Text Sources
Other Literature Sources
Molecular Biology Databases
Research Materials
Miscellaneous
