Novel human transitional B cell populations revealed by B cell depletion therapy - PubMed (original) (raw)
Novel human transitional B cell populations revealed by B cell depletion therapy
Arumugam Palanichamy et al. J Immunol. 2009.
Abstract
Transitional cells represent a crucial step in the differentiation and selection of the mature B cell compartment. Human transitional B cells have previously been variably identified based on the high level of expression of CD10, CD24, and CD38 relative to mature B cell populations and are expanded in the peripheral blood following rituximab-induced B cell-depletion at reconstitution. In this study, we take advantage of the gradual acquisition of the ABCB1 transporter during B cell maturation to delineate refined subsets of transitional B cells, including a late transitional B cell subset with a phenotype intermediate between T2 and mature naive. This late transitional subset appears temporally following the T1 and T2 populations in the peripheral compartment after rituximab-induced B cell reconstitution (and is thus termed T3) and is more abundant in normal peripheral blood than T1 and T2 cells. The identity of this subset as a developmental intermediate between early transitional and mature naive B cells was further supported by its ability to differentiate to naive during in vitro culture. Later transitional B cells, including T2 and T3, are found at comparatively increased frequencies in cord blood and spleen but were relatively rare in bone marrow. Additional studies demonstrate that transitional B cells mature across a developmental continuum with gradual up-regulation of mature markers, concomitant loss of immature markers, and increased responsiveness to BCR cross-linking in terms of proliferation, calcium flux, and survival. The characterization of multiple transitional B cell subpopulations provides important insights into human B cell development.
Figures
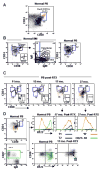
Figure 1. Reconstitution of peripheral blood B cell subsets after rituximab and revelation of a late transitional B cell population
(A) CD19+ gated peripheral blood B cells were examined by flow cytometry for the expression of CD38, CD24, and CD10 in a normal control in order to define the CD24 and CD38 expression level on CD10+ transitional B cells. (B) Further resolution of transitional B cells into T1 and T2 subsets. CD38 and CD24 levels on FSC- and SSC- gated CD19+ B cells in bone marrow (BM) was used to define the CD24/CD38 expression level on the T1 subset. BM is enriched for CD10+ precursor cells (inset histogram) which have uniformly high expression of CD24 and CD38 (+++) and based on additional analysis of IgD and IgM correspond to pre/pro, immature, and T1 B cells. The corresponding T1 population is depicted in PB with the T2 subset intermediate for CD24/CD38 (++) compared to mature naïve (+). (C) Immune reconstitution post-rituximab reveals an expansion of CD24hiCD38hi transitional B cells with progression from T1 to T2 to mature naïve over time. (D) Cells from normal and reconstituting PB were examined for R123 dye extrusion, which is reflective of expression of functional ABCB1 transporter by naïve B cells. The gating strategy on the CD24 v CD38 and CD27 v IgD dot plots is shown in color coded gates, with the respective R123 expression depicted in the histograms. The relatively inefficient R123 extrusion of the gated ‘N’ population in the reconstituting subject compared to the normal naïve population suggests an intermediate phenotype between T2 and mature naïve. This population is also revealed in the CD38 vs. R123 dot plots, with the gated T1 subset in blue and the CD27+ M in green.
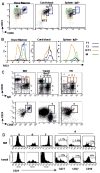
Figure 2
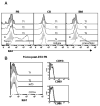
Resolution of discrete transitional B cell subsets in different lymphoid compartments (A) CD19+ B cells from bone marrow (BM), cord blood (CB), or spleen were examined for CD38, IgD and CD24 in order to define the N/T3, T2, and T1 cell populations. For spleen, the cells are gated on IgD in addition to CD19 in order to largely exclude the MZ B cells. For BM, the CD24/CD38+++ high cells (*) contain T1, immature, and pre-pro subsets as described in the prior figure. (B) R123 extrusion was examined in BM, CB, and spleen in the respective gated populations defined above. Compared to PB (Fig. 1) and BM N/T3 B cells (CD24intCD38int) from CB and spleen are shifted toward inefficient R123 extrusion, consistent with a less mature phenotype. (C) Position of the Bm2′ population (CD38hiIgD+ on CD38 vs. IgD plot) (red gate in BM, PB) in CD24 vs. CD38 dot plots in tonsil B cells differs from BM and PB. The Bm2′ subset is divided further (into populations c, d, e). In tonsil these are color gated (red, green, blue) to reveal that the majority of the Bm2′ subset falls outside of the transitional B cell gate in the CD24 vs. CD38 plot and instead represent CD24 low pre-GC cells. In the BM the blue gate delineates the Bm3 population (‘f’) (representing immature and precursor cells here). (D) The expression of CD24 on the gated populations b, d, and f from (C) is examined in BM vs. tonsil. In the BM the B cell populations from ‘b’ to ‘f’ display increased CD24 expression, whereas in the tonsil this progression to the GC population ‘f’ decreases CD24 expression, again indicating that the Bm2′ population in tonsil contains mainly pre-GC cells. Population ‘d’ from the Bm2′ population in the tonsil expresses CD77 and CD27, in contrast to the respective BM population. Results are representative of 4 bone marrow aspirates, 5 cord blood samples, 4 spleens, 5 tonsil specimens, and 7 peripheral blood samples.
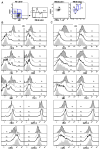
Figure 3. Phenotypic characterization of transitional B cells
(A) CD19+ B cells from normal PB were examined for CD27, IgD, CD24, CD38, and mitotracker extrusion to define the N, T3, T2, and T1 fractions shown. (B) Expression of discrete markers on the four populations defined above in PB. (C) Expression of discrete markers on the four populations in CB. Representative of more than 5 independent experiments.
Figure 4. Characterization of transitional B cells in spleen
(A) B cells from human spleen were examined for CD27, IgD, CD24, CD38, and mitotracker extrusion. CD21hiCD23lo cells were defined as the MZ. (B) Expression of discrete markers on the T1, T2, T3, and N populations defined above. For certain markers the expression on the MZ population is shown for comparison.
Figure 5. Additional phenotypic characterization of B cells in human spleen
(A) CD19+ splenocytes were examined for expression of CD21 and IgM to define three fractions in both the CD27− and CD27+ compartments. CD23 and CD38 levels were examined on these fractions. M=memory; MZP=marginal zone precursor; MZ=marginal zone. M2 indicates a second memory population in the CD27− fraction with different phenotypic characteristics, appearing in Fr. II. (B) IgD and CD1c levels on the populations defined in C.
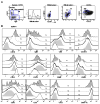
Figure 6
The T3 subset is non-proliferative in vivo and lacks activation marker expression. (A) B cells from PB, CB, and BM were examined for CD27, IgD, CD24, CD38, and mitotracker extrusion in order to define the T1, T2, T3, and N populations as described above. The intracellular expression of the proliferation antigen Ki67 was examined. In the CB graphs comparison to isotype control is shown, whereas in the PB and BM graphs positive controls depict the high Ki67 expression in tonsil GC cells and BM precursors. (B) Ki67 expression on discrete B cell populations and activation marker expression (CD69, CD86) on CD19+ B cells in a reconstituting subject after rituximab.
Figure 7
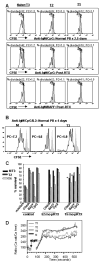
Transitional cells display reduced survival, proliferative capacity, and calcium flux compared to mature B cells. (A) B cells were purified by negative selection and depleted of CD27+ memory B cells from a representative normal control vs. reconstituting rituximab patient, loaded with CFSE, and cultured for 2.5 days with anti-IgM + CpG, BAFF, or CD40L as described in the Methods. Naïve/T3, T2, and T1 B cells were gated based on CD24 and CD38 expression as in Figure 1. The majority of CD24+CD38+ (naïve) B cells undergo 1 or 2 rounds of division, whereas the CD24++CD38++ (T2) B cells proliferate less efficiently and the CD24+++CD38+++ (T1) B cells even less so. This is reflected in the lower %divided (responder frequency) and proliferative capacities (PC) calculated from the plots by the method of Wells et al. (25). The gray filled line graph depicts non-proliferating cells cultured in medium alone. (B) Response of sorted CFSE-labeled memory (M) (CD27+), naïve (N), and T3 B cells to BCR-cross-linking (anti-IgM) + CpG + IL2 after 4 days of culture. B cell populations were sorted as described in Figure 3 and Figure 8 to >90% purity. Plots show resulting CFSE levels on live CD19+ cells at day 4 of culture with unstimulated cells in the gray filled line graphs. Proliferative capacities (PC) calculated from the plots by the method of Wells et al. (25) are shown. All CD19+ populations displayed 100% responder frequencies at day 4 of culture under these conditions. (C) B cells purified and gated as in A were cultured for 2.5 days in the presence of the indicated stimuli. For normal controls, survival of the N/T3 subset is greater than the T2 subset which is greater than the T1 subset. For early reconstituting subjects, the survival of the N/T3 B cells is significantly lower than T2 (*). (D) Calcium responses in normal peripheral blood B cells after anti-IgD or anti-IgM stimulation. B cells were purified by negative selection and stained with CD2, CD27, CD3, CD14, and CD16 antibodies (to gate out non-B cells and memory B cells). The expression of CD27, CD24, CD38, and mitotracker extrusion was used in order to define the T1, T2, T3, and N populations as described in Figure 3. The median responses are depicted for the gated B cell populations after the addition of 20μg/ml of Fab′2 anti-IgM. Data are representative of at least 3 independent experiments for (A)–(C).
Figure 8
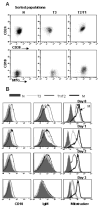
T3 B cells differentiate into mature naïve in vitro. (A) B cell subsets were sorted from PB on a FACSAria using the surface markers (CD27, IgD, CD24, and CD38) and sorting strategy (MTG) defined in Figure 3. The sort purity is depicted based on the expression of CD24 vs. CD38 and CD10 vs. MTG and is >90%. (B) Sort purified populations were cultured with anti-IgM/CpG/IL2, harvested at the indicated time points, stained with the indicated antibodies, and dye retention examined to define the MTG− naïve B cell population.
Similar articles
- Transitional B cells in humans: characterization and insight from B lymphocyte reconstitution after hematopoietic stem cell transplantation.
Marie-Cardine A, Divay F, Dutot I, Green A, Perdrix A, Boyer O, Contentin N, Tilly H, Tron F, Vannier JP, Jacquot S. Marie-Cardine A, et al. Clin Immunol. 2008 Apr;127(1):14-25. doi: 10.1016/j.clim.2007.11.013. Epub 2008 Jan 10. Clin Immunol. 2008. PMID: 18191619 - BAFF receptor signaling aids the differentiation of immature B cells into transitional B cells following tonic BCR signaling.
Rowland SL, Leahy KF, Halverson R, Torres RM, Pelanda R. Rowland SL, et al. J Immunol. 2010 Oct 15;185(8):4570-81. doi: 10.4049/jimmunol.1001708. Epub 2010 Sep 22. J Immunol. 2010. PMID: 20861359 Free PMC article. - Characterization of splenic CD21hi T2 B cells.
Verma S, Waldschmidt TJ. Verma S, et al. Immunol Res. 2007;39(1-3):240-8. doi: 10.1007/s12026-007-0072-5. Immunol Res. 2007. PMID: 17917068 Review. - Identification and characterization of a human CD5+ pre-naive B cell population.
Lee J, Kuchen S, Fischer R, Chang S, Lipsky PE. Lee J, et al. J Immunol. 2009 Apr 1;182(7):4116-26. doi: 10.4049/jimmunol.0803391. J Immunol. 2009. PMID: 19299709 - Fate decisions regulating bone marrow and peripheral B lymphocyte development.
Monroe JG, Dorshkind K. Monroe JG, et al. Adv Immunol. 2007;95:1-50. doi: 10.1016/S0065-2776(07)95001-4. Adv Immunol. 2007. PMID: 17869609 Review.
Cited by
- Understanding Autoimmunity: Mechanisms, Predisposing Factors, and Cytokine Therapies.
Yasmeen F, Pirzada RH, Ahmad B, Choi B, Choi S. Yasmeen F, et al. Int J Mol Sci. 2024 Jul 12;25(14):7666. doi: 10.3390/ijms25147666. Int J Mol Sci. 2024. PMID: 39062908 Free PMC article. Review. - B cells and progressive multifocal leukoencephalopathy: search for the missing link.
Durali D, de Goër de Herve MG, Gasnault J, Taoufik Y. Durali D, et al. Front Immunol. 2015 May 19;6:241. doi: 10.3389/fimmu.2015.00241. eCollection 2015. Front Immunol. 2015. PMID: 26042124 Free PMC article. Review. - CpG-ODN-induced sustained expression of BTLA mediating selective inhibition of human B cells.
Thibult ML, Rivals JP, Mamessier E, Gertner-Dardenne J, Pastor S, Speiser DE, Derré L, Olive D. Thibult ML, et al. J Mol Med (Berl). 2013 Feb;91(2):195-205. doi: 10.1007/s00109-012-0943-7. Epub 2012 Aug 19. J Mol Med (Berl). 2013. PMID: 22903545 Clinical Trial. - Differences in the composition of the human antibody repertoire by B cell subsets in the blood.
Mroczek ES, Ippolito GC, Rogosch T, Hoi KH, Hwangpo TA, Brand MG, Zhuang Y, Liu CR, Schneider DA, Zemlin M, Brown EE, Georgiou G, Schroeder HW Jr. Mroczek ES, et al. Front Immunol. 2014 Mar 19;5:96. doi: 10.3389/fimmu.2014.00096. eCollection 2014. Front Immunol. 2014. PMID: 24678310 Free PMC article. - Anergic responses characterize a large fraction of human autoreactive naive B cells expressing low levels of surface IgM.
Quách TD, Manjarrez-Orduño N, Adlowitz DG, Silver L, Yang H, Wei C, Milner EC, Sanz I. Quách TD, et al. J Immunol. 2011 Apr 15;186(8):4640-8. doi: 10.4049/jimmunol.1001946. Epub 2011 Mar 11. J Immunol. 2011. PMID: 21398610 Free PMC article.
References
- Chung JB, Silverman M, Monroe JG. Transitional B cells: step by step towards immune competence. Trends in Immunology. 2003;24:342–348. - PubMed
- Su TT, Rawlings DJ. Transitional B lymphocyte subsets operate as distinct checkpoints in murine splenic B cell development. J Immunol. 2002;168:2101–2110. - PubMed
- Wardemann H, Yurasov S, Schaefer A, Young JW, Meffre E, Nussenzweig MC. Predominant Autoantibody Production by Early Human B Cell Precursors. Science. 2003;301:1374–1377. - PubMed
Publication types
MeSH terms
Grants and funding
- K08 AR048303/AR/NIAMS NIH HHS/United States
- K08AR048303/AR/NIAMS NIH HHS/United States
- U19 AI056390/AI/NIAID NIH HHS/United States
- R01 AI077674/AI/NIAID NIH HHS/United States
- U19AI56390/AI/NIAID NIH HHS/United States
- R01AI077674-01A1/AI/NIAID NIH HHS/United States
- R01 AI077674-02/AI/NIAID NIH HHS/United States
- U19 AI056390-06/AI/NIAID NIH HHS/United States
- R01 AI049660/AI/NIAID NIH HHS/United States
- R01 AI049660-01A1/AI/NIAID NIH HHS/United States
- R37 AI049660/AI/NIAID NIH HHS/United States
LinkOut - more resources
Full Text Sources
Research Materials
