Functional connectivity of the macaque brain across stimulus and arousal states - PubMed (original) (raw)
Functional connectivity of the macaque brain across stimulus and arousal states
Sebastian Moeller et al. J Neurosci. 2009.
Abstract
Cortical networks generate temporally correlated brain activity. To clarify the functional significance of this correlated activity, we asked whether and how its structure depends on stimulus and arousal state. Using independent components analysis of macaque functional magnetic resonance imaging data, we identified a large number of brain networks that were strikingly reproducible across different visual stimulus contexts. Fewer networks were reproducible across alert and anesthetized brain states. Network complexity ranged from bilateral single-node networks to networks comprising multiple discrete nodes distributed over 3 cm of cortex; one network identified in our survey included parts of the temporal parietal occipital junction, dorsal premotor cortex, insula, and posterior cingulate cortex bilaterally. Our results reveal the wealth of spatially structured correlated networks throughout the brain in both alert and anesthetized monkeys, and show that anesthesia significantly alters the spatial structure of these networks.
Figures
Figure 1.
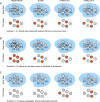
Three scenarios for the dependence of ICs on stimulus and arousal state. A, If the structure of a network remains constant regardless of stimulus or arousal state (i.e., columns 1–4 yield the same ICA result), then the network likely reflects fixed anatomical connections that can be driven by spontaneous activity. B, If the structure of a network remains constant regardless of the stimulus state (i.e., columns 2–4 yield the same ICA result), but does depend on the arousal state (e.g., showing greater or less connectivity during anesthesia, column 1), then the network likely reflects a brain state unique to alertness or anesthesia. C, If the structure of a network depends on the presence of specific stimuli, then the network likely reflects a changeable, stimulus-dependent brain state.
Figure 2.
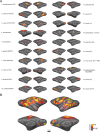
ICs from one animal (monkey L). The stimulus consisted of movie clips from “James Bond, Tomorrow Never Dies” (see supplemental Fig. S1_A_, available at
as supplemental material, for a summary of the stimulus sequence). A, All 20 ICs determined to represent functional networks based on an IC quality score combining reproducibility across days and bilaterality (see Materials and Methods for details). The ICs are rendered on inflated cortical surfaces and are ordered according to their IC score. B, The ICs in A are overlaid on a single surface to show the overall extent of brain coverage. The color scale bar shown here applies to all figures in this study.
Figure 3.
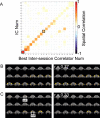
Spatial reproducibility of ICs. A, Matrix of spatial correlation values between the 20 ICs shown in Figure 2 and the set of 20 “best intersession correlators.” For each IC, the best intersession correlator was defined as the IC obtained from an independent scan session using the same stimulus showing the highest spatial correlation. B, C, Coronal slices (from posterior to anterior) showing two ICs (left) and their best intersession correlators (right). The two ICs are indicated by the black squares in A. Num, Number.
Figure 4.
ICA reveals stimulus-driven networks (monkey B). A, Retinotopic map obtained by comparing the response to a vertical wedge vs a horizontal wedge. The solid lines indicate representations of the horizontal meridian and dotted lines representations of the vertical meridian. B, Top, ICA of the same data set as in A revealed the two ICs shown here (as well as many others). IC 1 corresponds to the representation of the vertical meridian, IC 2 to the representation of the horizontal meridian (the numbering of the ICs here is arbitrary). C, Map of areas activated by disparity-defined shapes compared with a zero-disparity plane (see supplemental Fig. S2_C_, available at
as supplemental material, for stimulus details). D, IC obtained from ICA of the same data set as in C. IC 1 corresponds to the map of 3D-selective areas revealed by the GLM comparison in C.
Figure 5.
Classification of ICs based on reproducibility under different visual stimulus states (analysis based on the same data set as in supplemental Figure S7, available at
as supplemental material). A, Bar graph showing the total number of ICs (dark blue bars), the number of ICs that were reproducible with the same stimulus and at least one different stimulus (cyan bars), and the number of ICs reproducible only with the same stimulus (yellow bars on top of cyan bars). The criterion for reproducibility was r > 0.1. B, Bar graph showing, for ICs obtained with each stimulus condition, the mean fraction of ICs from the five other stimulus conditions that were correlated (i.e., r > 0.1). C, The mean correlation value between each IC and its best intersession (blue) and best interstimulus (red) correlator; computation restricted to ICs reproducible both with the same and with at least one different stimulus. In both cases, correlation coefficients were computed between ICs obtained from separate scan sessions.
Figure 6.
Comparison of ICs obtained with and without visual stimulation for two monkeys. A, B, ICs obtained during stimulation with a retinotopic localizer stimulus (top) and with a blank screen in which only a fixation spot was visible (bottom). The two stimulus conditions were interleaved within each scan session. Note the similarity between the IC sets obtained with and without a visual stimulus. C, D, Matrices of spatial correlation values between the real ICs obtained under the two stimulus conditions (same conventions as in supplemental Fig. S7, available at
as supplemental material). Mean SNR for retinotopy condition: 41.6 (monkey B), 35.1 (monkey M); mean SNR for blank condition: 40.3 (monkey B), 37.7 (monkey M).
Figure 7.
ICs obtained under ketamine anesthesia. The monkey's eyes were closed throughout the experiment. A, Twenty-nine ICs from the anesthetized monkey brain shown on an inflated surface. B, Matrix of spatial correlation values between the 39 real ICs obtained with the retinotopic localizer and the best matches obtained under anesthesia. The retinotopic localizer scans covered a smaller brain volume than the anesthetized scans; spatial correlation computations were therefore restricted to the brain region covered by the retinotopic localizer scans. C, Histograms of the distribution of spatial correlations between ICs obtained with the retinotopic localizer and with anesthesia (Anesth; blue bars) (mean r = 0.28), and between ICs obtained with the retinotopic localizer and with a blank stimulus (red bars) (mean r = 0.16). The means are significantly different (t test, p < 1.3*10−4). D, Five selected ICs are shown separately, in surface format and in coronal slices (spanning −19 to +22 mm relative to the interaural canal). Results from monkey B.
Figure 8.
The CIPS network under different stimulus states. A, Top (identical to Fig. 4_D_), IC corresponding to V3, V3A, and CIPS, obtained from ICA of fMRI data obtained with a disparity stimulus. Coronal slices covering the activated region are shown on the right (millimeters posterior to the interaural canal indicated in top left corner). Bottom, Time course from this IC, showing activation during disparity epochs. Retinotopic area borders determined by retinotopic localizer experiment (Fig. 4_A_); CIPS area borders determined by disparity localizer experiment (Fig. 4_C_). B, Top, IC corresponding to CIPS obtained from retinotopic localizer data. Bottom, Time course from this IC. C, Top, IC corresponding to CIPS obtained from blank screen data. Bottom, Time course from this IC. D, Top, IC corresponding to CIPS obtained from anesthetized data. Bottom, Time course from this IC. E, Top, A second IC obtained from the same data set as in A. Bottom, Time course from this IC shows that this IC was much less strongly modulated by disparity than the IC in A.
Figure 9.
An IC with six nodes. A, Example of network including parts of the TPO, dysgranular and granular insula, posterior cingulate, and dorsal premotor cortex, imaged in two sessions of the face localizer stimulus and one session of the disparity stimulus. Data for three experiments shown on inflated surface. B, Same data shown on slices, from −11 to +20.5 mm relative to the interaural canal.
Similar articles
- Visual target modulation of functional connectivity networks revealed by self-organizing group ICA.
van de Ven V, Bledowski C, Prvulovic D, Goebel R, Formisano E, Di Salle F, Linden DE, Esposito F. van de Ven V, et al. Hum Brain Mapp. 2008 Dec;29(12):1450-61. doi: 10.1002/hbm.20479. Hum Brain Mapp. 2008. PMID: 17990304 Free PMC article. - Emotion-Induced Topological Changes in Functional Brain Networks.
Park CH, Lee HK, Kweon YS, Lee CT, Kim KT, Kim YJ, Lee KU. Park CH, et al. Brain Topogr. 2016 Jan;29(1):108-17. doi: 10.1007/s10548-015-0449-z. Epub 2015 Aug 29. Brain Topogr. 2016. PMID: 26318849 - An affective circumplex model of neural systems subserving valence, arousal, and cognitive overlay during the appraisal of emotional faces.
Gerber AJ, Posner J, Gorman D, Colibazzi T, Yu S, Wang Z, Kangarlu A, Zhu H, Russell J, Peterson BS. Gerber AJ, et al. Neuropsychologia. 2008;46(8):2129-39. doi: 10.1016/j.neuropsychologia.2008.02.032. Epub 2008 Mar 18. Neuropsychologia. 2008. PMID: 18440572 Free PMC article. - The cortical visual area V6 in macaque and human brains.
Fattori P, Pitzalis S, Galletti C. Fattori P, et al. J Physiol Paris. 2009 Jan-Mar;103(1-2):88-97. doi: 10.1016/j.jphysparis.2009.05.012. Epub 2009 Jun 10. J Physiol Paris. 2009. PMID: 19523515 Review. - Opportunities and limitations of intrinsic functional connectivity MRI.
Buckner RL, Krienen FM, Yeo BT. Buckner RL, et al. Nat Neurosci. 2013 Jul;16(7):832-7. doi: 10.1038/nn.3423. Epub 2013 Jun 25. Nat Neurosci. 2013. PMID: 23799476 Review.
Cited by
- Interconnected sub-networks of the macaque monkey gustatory connectome.
Hartig R, Karimi A, Evrard HC. Hartig R, et al. Front Neurosci. 2023 Feb 16;16:818800. doi: 10.3389/fnins.2022.818800. eCollection 2022. Front Neurosci. 2023. PMID: 36874640 Free PMC article. - Common functional localizers to enhance NHP & cross-species neuroscience imaging research.
Russ BE, Petkov CI, Kwok SC, Zhu Q, Belin P, Vanduffel W, Hamed SB. Russ BE, et al. Neuroimage. 2021 Aug 15;237:118203. doi: 10.1016/j.neuroimage.2021.118203. Epub 2021 May 25. Neuroimage. 2021. PMID: 34048898 Free PMC article. - A causal role for the pulvinar in coordinating task-independent cortico-cortical interactions.
Eradath MK, Pinsk MA, Kastner S. Eradath MK, et al. J Comp Neurol. 2021 Dec;529(17):3772-3784. doi: 10.1002/cne.25193. Epub 2021 May 30. J Comp Neurol. 2021. PMID: 34013540 Free PMC article. - A Virtual Reality Meditative Intervention Modulates Pain and the Pain Neuromatrix in Patients with Opioid Use Disorder.
Faraj MM, Lipanski NM, Morales A, Goldberg E, Bluth MH, Marusak HA, Greenwald MK. Faraj MM, et al. Pain Med. 2021 Nov 26;22(11):2739-2753. doi: 10.1093/pm/pnab162. Pain Med. 2021. PMID: 33956146 Free PMC article. - Combining brain perturbation and neuroimaging in non-human primates.
Klink PC, Aubry JF, Ferrera VP, Fox AS, Froudist-Walsh S, Jarraya B, Konofagou EE, Krauzlis RJ, Messinger A, Mitchell AS, Ortiz-Rios M, Oya H, Roberts AC, Roe AW, Rushworth MFS, Sallet J, Schmid MC, Schroeder CE, Tasserie J, Tsao DY, Uhrig L, Vanduffel W, Wilke M, Kagan I, Petkov CI. Klink PC, et al. Neuroimage. 2021 Jul 15;235:118017. doi: 10.1016/j.neuroimage.2021.118017. Epub 2021 Mar 29. Neuroimage. 2021. PMID: 33794355 Free PMC article. Review.
References
- Arieli A, Sterkin A, Grinvald A, Aertsen A. Dynamics of ongoing activity: explanation of the large variability in evoked cortical responses. Science. 1996;273:1868–1871. - PubMed
- Augustine JR. Circuitry and functional aspects of the insular lobe in primates including humans. Brain Res Brain Res Rev. 1996;22:229–244. - PubMed
- Bartels A, Zeki S. The chronoarchitecture of the human brain—natural viewing conditions reveal a time-based anatomy of the brain. Neuroimage. 2004;22:419–433. - PubMed
- Bartels A, Zeki S. Brain dynamics during natural viewing conditions—a new guide for mapping connectivity in vivo. Neuroimage. 2005a;24:339–349. - PubMed
Publication types
MeSH terms
Substances
LinkOut - more resources
Full Text Sources


