The "Down syndrome critical region" is sufficient in the mouse model to confer behavioral, neurophysiological, and synaptic phenotypes characteristic of Down syndrome - PubMed (original) (raw)
The "Down syndrome critical region" is sufficient in the mouse model to confer behavioral, neurophysiological, and synaptic phenotypes characteristic of Down syndrome
Nadia P Belichenko et al. J Neurosci. 2009.
Abstract
Down syndrome (DS) can be modeled in mice segmentally trisomic for mouse chromosome 16. Ts65Dn and Ts1Cje mouse models have been used to study DS neurobiological phenotypes including changes in cognitive ability, induction of long-term potentiation (LTP) in the fascia dentata (FD), the density and size of dendritic spines, and the structure of synapses. To explore the genetic basis for these phenotypes, we examined Ts1Rhr mice that are trisomic for a small subset of the genes triplicated in Ts65Dn and Ts1Cje mice. The 33 trisomic genes in Ts1Rhr represent a "DS critical region" that was once predicted to be sufficient to produce most DS phenotypes. We discovered significant alterations in an open field test, a novel object recognition test and in a T-maze task. As in Ts65Dn and Ts1Cje mice, LTP in FD of Ts1Rhr could be induced only after blocking GABA(A)-dependent inhibitory neurotransmission. In addition, widespread enlargement of dendritic spines and decreased density of spines in FD were preserved in Ts1Rhr. Twenty of 48 phenotypes showed significant differences between Ts1Rhr and 2N controls. We conclude that important neurobiological phenotypes characteristic of DS are conserved in Ts1Rhr mice. The data support the view that biologically significant trisomic phenotypes occur because of dosage effects of genes in the Ts1Rhr trisomic segment and that increased dosage is sufficient to produce these changes. The stage is now set for studies to decipher the gene(s) that play a conspicuous role in creating these phenotypes.
Figures
Figure 1.
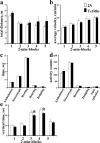
Spontaneous locomotor activity test of control (2N) and Ts1Rhr mice. The activity is shown in five sequential blocks of 2 min each. a, Total activity. b, Average velocity. c, Activity time. d, Activity counts. e, Vertical time. Results are mean ± SEM. Number of mice examined: 2N = 15; Ts1Rhr = 23. *p < 0.05, significantly different from 2N mice. Amb., Ambulatory.
Figure 2.
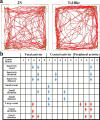
Novel open field activity test. a, Representative activity tracers for 2N and Ts1Rhr mice during 10 min. b, Quantitative analysis of novel open field activity test breaking by 2 min blocks. Blue arrows show significantly decreased values and red arrows, significantly increased values for Ts1Rhr versus 2N. Note that Ts1Rhr mice spend more time and distance on average in the periphery of the field than 2N mice.
Figure 3.
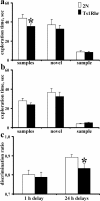
Novel object recognition test. a, Exploration time for the first 10 min familiarization phase for two identical objects (samples) and for the 1 h delay second 3 min phase for novel (novel) and old (sample) objects presentation. b, Exploration time as for a with 24 h delay. c, Discrimination ratio for novel object recognition test with 1 and 24 h delays. Results are mean ± SEM. Number of mice examined: 2N = 15; Ts1Rhr = 23. *p < 0.05, significantly different from 2N mice.
Figure 4.
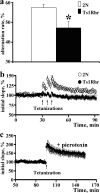
Hippocampal-dependent learning and synaptic plasticity in 2N and Ts1Rhr mice. a, Continuous alternation task in T-maze reveals dysfunction of the hippocampal system in Ts1Rhr mice. Number of mice examined: 2N = 15; Ts1Rhr = 23. b, Induction of LTP was also deficient in Ts1Rhr fascia dentata. Time course of the averaged initial slope of the fEPSP. A series of three tetanizations (arrows) applied at 5 min intervals evoked stable LTP in 2N, but failed to induce LTP in the Ts1Rhr FD (open and filled circles, respectively). c, A single tetanization train (arrow) evoked stable LTP in both 2N and Ts1Rhr FD after suppressing inhibition with picrotoxin. The results are mean ± SEM. The number of mice/slices examined: 2N = 6/6; Ts1Rhr = 6/6. *p < 0.05, significantly different from 2N mice.
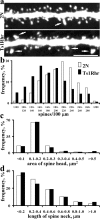
Figure 5.
Spine morphology and analysis of the dendrites of granule cells of fascia dentata. a, Confocal images of Lucifer yellow-microinjected dendrites and their spines in 2N and Ts1Rhr mice. Note enlarged spines in Ts1Rhr mice (arrows) as well as a reduction in their number in fascia dentata. Scale bar, 5 μm. b–d, Quantitative analysis of the frequency distributions of spine densities (b), spine head areas (c), and spine neck lengths (d) in 2N (open bars) and Ts1Rhr (solid bars) mice. Number of mice examined: 2N = 3; Ts1Rhr = 3.
Similar articles
- Synaptic and cognitive abnormalities in mouse models of Down syndrome: exploring genotype-phenotype relationships.
Belichenko PV, Kleschevnikov AM, Salehi A, Epstein CJ, Mobley WC. Belichenko PV, et al. J Comp Neurol. 2007 Oct 1;504(4):329-45. doi: 10.1002/cne.21433. J Comp Neurol. 2007. PMID: 17663443 - Trisomy for the Down syndrome 'critical region' is necessary but not sufficient for brain phenotypes of trisomic mice.
Olson LE, Roper RJ, Sengstaken CL, Peterson EA, Aquino V, Galdzicki Z, Siarey R, Pletnikov M, Moran TH, Reeves RH. Olson LE, et al. Hum Mol Genet. 2007 Apr 1;16(7):774-82. doi: 10.1093/hmg/ddm022. Epub 2007 Mar 5. Hum Mol Genet. 2007. PMID: 17339268 - Lifespan analysis of brain development, gene expression and behavioral phenotypes in the Ts1Cje, Ts65Dn and Dp(16)1/Yey mouse models of Down syndrome.
Aziz NM, Guedj F, Pennings JLA, Olmos-Serrano JL, Siegel A, Haydar TF, Bianchi DW. Aziz NM, et al. Dis Model Mech. 2018 Jun 12;11(6):dmm031013. doi: 10.1242/dmm.031013. Dis Model Mech. 2018. PMID: 29716957 Free PMC article. - Influence of allelic differences in Down syndrome.
Roper RJ, Hawley L, Goodlett CR. Roper RJ, et al. Prog Brain Res. 2020;251:29-54. doi: 10.1016/bs.pbr.2019.09.001. Epub 2019 Oct 24. Prog Brain Res. 2020. PMID: 32057311 Free PMC article. Review. - On the cause of mental retardation in Down syndrome: extrapolation from full and segmental trisomy 16 mouse models.
Galdzicki Z, Siarey R, Pearce R, Stoll J, Rapoport SI. Galdzicki Z, et al. Brain Res Brain Res Rev. 2001 Apr;35(2):115-45. doi: 10.1016/s0926-6410(00)00074-4. Brain Res Brain Res Rev. 2001. PMID: 11336779 Review.
Cited by
- Rescuing Over-activated Microglia Restores Cognitive Performance in Juvenile Animals of the Dp(16) Mouse Model of Down Syndrome.
Pinto B, Morelli G, Rastogi M, Savardi A, Fumagalli A, Petretto A, Bartolucci M, Varea E, Catelani T, Contestabile A, Perlini LE, Cancedda L. Pinto B, et al. Neuron. 2020 Dec 9;108(5):887-904.e12. doi: 10.1016/j.neuron.2020.09.010. Epub 2020 Oct 6. Neuron. 2020. PMID: 33027640 Free PMC article. - Human chromosome 21 orthologous region on mouse chromosome 17 is a major determinant of Down syndrome-related developmental cognitive deficits.
Zhang L, Meng K, Jiang X, Liu C, Pao A, Belichenko PV, Kleschevnikov AM, Josselyn S, Liang P, Ye P, Mobley WC, Yu YE. Zhang L, et al. Hum Mol Genet. 2014 Feb 1;23(3):578-89. doi: 10.1093/hmg/ddt446. Epub 2013 Sep 16. Hum Mol Genet. 2014. PMID: 24041763 Free PMC article. - Enhanced Dendritic Inhibition and Impaired NMDAR Activation in a Mouse Model of Down Syndrome.
Schulz JM, Knoflach F, Hernandez MC, Bischofberger J. Schulz JM, et al. J Neurosci. 2019 Jun 26;39(26):5210-5221. doi: 10.1523/JNEUROSCI.2723-18.2019. Epub 2019 Apr 18. J Neurosci. 2019. PMID: 31000585 Free PMC article. - Alzheimer's disease therapeutics targeted to the control of amyloid precursor protein translation: maintenance of brain iron homeostasis.
Bandyopadhyay S, Rogers JT. Bandyopadhyay S, et al. Biochem Pharmacol. 2014 Apr 15;88(4):486-94. doi: 10.1016/j.bcp.2014.01.032. Epub 2014 Feb 7. Biochem Pharmacol. 2014. PMID: 24513321 Free PMC article. Review. - Genetic dissection of the Down syndrome critical region.
Jiang X, Liu C, Yu T, Zhang L, Meng K, Xing Z, Belichenko PV, Kleschevnikov AM, Pao A, Peresie J, Wie S, Mobley WC, Yu YE. Jiang X, et al. Hum Mol Genet. 2015 Nov 15;24(22):6540-51. doi: 10.1093/hmg/ddv364. Epub 2015 Sep 15. Hum Mol Genet. 2015. PMID: 26374847 Free PMC article.
References
- Ahn KJ, Jeong HK, Choi HS, Ryoo SR, Kim YJ, Goo JS, Choi SY, Han JS, Ha I, Song WJ. DYRK1A BAC transgenic mice show altered synaptic plasticity with learning and memory defects. Neurobiol Dis. 2006;22:463–472. - PubMed
- Altafaj X, Dierssen M, Baamonde C, Martí E, Visa J, Guimerà J, Oset M, González JR, Flórez J, Fillat C, Estivill X. Neurodevelopmental delay, motor abnormalities and cognitive deficits in transgenic mice overexpressing Dyrk1A (minibrain), a murine model of Down's syndrome. Hum Mol Genet. 2001;10:1915–1923. - PubMed
- Amano K, Sago H, Uchikawa C, Suzuki T, Kotliarova SE, Nukina N, Epstein CJ, Yamakawa K. Dosage-dependent over-expression of genes in the trisomic region of Ts1Cje mouse model for Down syndrome. Hum Mol Genet. 2004;13:1333–1340. - PubMed
- Belichenko PV, Masliah E, Kleschevnikov AM, Villar AJ, Epstein CJ, Salehi A, Mobley WC. Synaptic structural abnormalities in the Ts65Dn mouse model of Down Syndrome. J Comp Neurol. 2004;480:281–298. - PubMed
Publication types
MeSH terms
Grants and funding
- NS24054/NS/NINDS NIH HHS/United States
- R01 NS055371/NS/NINDS NIH HHS/United States
- HD38384/HD/NICHD NIH HHS/United States
- R01 AG016999/AG/NIA NIH HHS/United States
- NS38869/NS/NINDS NIH HHS/United States
- R01 NS024054/NS/NINDS NIH HHS/United States
- AG16999/AG/NIA NIH HHS/United States
- NS055371/NS/NINDS NIH HHS/United States
- R01 HD038384/HD/NICHD NIH HHS/United States
- R01 NS038869/NS/NINDS NIH HHS/United States
LinkOut - more resources
Full Text Sources
Other Literature Sources
Medical
Molecular Biology Databases
Research Materials
