Interplay between activin and Hox genes determines the formation of the kidney morphogenetic field - PubMed (original) (raw)
. 2009 Jun;136(12):1995-2004.
doi: 10.1242/dev.035592. Epub 2009 May 13.
Affiliations
- PMID: 19439491
- PMCID: PMC2685723
- DOI: 10.1242/dev.035592
Interplay between activin and Hox genes determines the formation of the kidney morphogenetic field
Ella Preger-Ben Noon et al. Development. 2009 Jun.
Abstract
The kidney develops in a specific position along the anterior-posterior axis. All vertebrate kidney tissues are derived from the intermediate mesoderm (IM), and early kidney genes such as Lim1 and Pax2 are expressed in amniotes posterior to the sixth somite axial level. IM cells anterior to this level do not express kidney genes owing to changes in their competence to respond to kidney-inductive signals present along the entire axis. We aimed to understand the molecular mechanisms governing the loss of competence of anterior IM cells and the formation of the anterior border of the kidney morphogenetic field. We identified the dorsal neural tube as the potential kidney-inductive tissue and showed that activin, a secreted morphogen, is necessary but insufficient for Lim1 induction and establishment of the kidney field. Activin or activin-like and BMP signaling cascades are activated along the entire axis, including in anterior non-kidney IM, suggesting that competence to respond to these signals involves downstream or other components. Detailed expression pattern analysis of Hox genes during early chick development revealed that paralogous group four genes share the same anterior border as the kidney genes. Ectopic expression of Hoxb4 in anterior non-kidney IM, either by retinoic acid (RA) administration or plasmid-mediated overexpression, resulted in ectopic kidney gene expression. The anterior expansion of Lim1 expression was restrained when Hoxb4 was co-expressed with a truncated form of activin receptor. We suggest a model in which the competence of IM cells to respond to TGFbeta signaling and express kidney genes is driven by RA and mediated by Hoxb4.
Figures
Fig. 1.
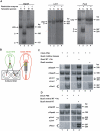
The dorsal neural tube secretes kidney-inductive signals. (A) Discrimination between chick and quail RT-PCR products by restriction site analysis. Each set of PCR primers was used to amplify cDNA from stage 12 chick (C) or quail (Q) embryos. PCR products were analyzed directly (lanes 1, 3) or following digestion by restriction enzymes that specifically recognize the chick sequences (lanes 2, 4). The identity of the bands and their sizes are labeled (U, uncut). (B) Scheme describing the experimental design. (C) Two parallel PS6 regions from chick embryos were isolated and cultured for 24 hours with or without isolated anterior midline tissues [neural tube (NT), notochord and somites 2-4] or NT and notochord (NT+Nc) or somites 2-4 of stage 10 quail embryos. Lim1 and Pax2 expression was analyzed by RT-PCR followed by restriction enzyme digestion (see A). Amplification of Gapdh transcript was used to compare RNA levels in each sample. For Pax2 transcripts, only the digested products are shown. (D) Two parallel PS6 regions from chick embryos were cultured for 24 hours with or without dorsal NT or ventral NT plus notochord (NT+Nc) of stage 10 quail embryos. Gapdh, Lim1 and_Pax2_ expression was analyzed as described in B. Genes are from quail (q) or chick (c).
Fig. 2.
TGFβ signaling in intermediate mesoderm specification. (A) Scheme summarizing the architecture of tissues and their morphogens at the time and location the kidney morphogenetic field is specified. (B) Two parallel PS6 regions from chick embryos were isolated and cultured for 24 hours with or without 10 ng/ml activin. Gapdh, Lim1 and Pax2 expression was analyzed by RT-PCR. (C-P) Profile of Smad2 and Smad1/5/8 activation during intermediate mesoderm (IM) specification. Stage 8 (C) and stage 6 (D) chick embryos were fixed and sectioned, followed by double immunostaining using anti-phospho-Smad2 (E,G,I) or anti-phospho-Smad1/5/8 (K,M,O) together with anti-Lim1/2 antibodies. DAPI staining is shown in F,H,J,L,N,P. Analysis was performed at the second somite level of stage 8 chick embryos (magenta line in C), and at the level of Hensen's node of stage 8 (green line in C) and stage 6 (turquoise line in D) chick embryos. IM is indicated by arrows. Hn, Hensen's node; Nc, notochord; NP, neural plate; psm, pre-segmented mesoderm; s, somite. Scale bars: 100 μm.
Fig. 3.
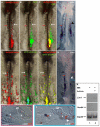
Hoxb4 expression patterns during early chick development. (A-G) Whole-mount RNA in situ hybridization (ISH) using a_Hoxb4_ probe. Hamburger and Hamilton (HH) stages are indicated. Black arrows mark Hensen's node. Red arrows in B-D point to gastrulating cells expressing Hoxb4. Red lines mark the sixth somite axial level. (A-F) Ventral view; (G) dorsal view. (H-K) Cross-sections at the level of H-K in C,F. Dashed circles mark the IM (J,K). (L) Scheme of the expression patterns of several Hox genes in the IM of a chick embryo. Bars with a blue margin represent Hox genes that have an anterior boundary at the sixth somite level. NE, neuroepithelium; m, mesoderm; NT, neural tube; s, somite; LPM, lateral plate mesoderm. Scale bars: 100 μm.
Fig. 4.
Retinoic acid induces anterior Lim1 and Hoxb4 expansion in the IM. (A) A retinoic acid (RA)-soaked bead (arrow) was implanted in the migratory pathway of IM cells of a stage 4 chick embryo. (B) Twenty-four hours after implantation, the bead reached a location in the anterior IM (arrow). (C) Whole-mount ISH for Lim1 reveals specific IM anterior expansion of expression (arrowhead) as compared with the contralateral side. The red line marks the sixth somite border. The arrow marks the RA-soaked bead. (D) Cross-section through the region indicated by the bar in C clearly shows that Lim1 expansion is specific to the IM of the experimental side (arrowhead). (E) Cross-section of another embryo through the anterior IM close to the RA bead shows upregulation of Hoxb4 expression in IM tissues (arrowhead) as compared with the contralateral control side. IM is encircled by dashed lines. (F) Two parallel IM6 regions were isolated and cultured for 24 hours with or without 10 μM RA. Lim1, Hoxb4 and Gapdh expression was analyzed by RT-PCR. NT, neural tube; s, somite. Scale bars: 100 μm.
Fig. 5.
Overexpression of Hoxb4 results in anterior Lim1 expansion. (A-D) pCIZ control (A,B) or Hoxb4 expression (C,D) vector driving internal ribosome entry site 2 (IRES2)-ZsGreen1 expression was electroporated into the prospective IM region of PS3. Eighteen hours after electroporation, ZsGreen1 expression marking the location of the control (A) or Hoxb4 expression (C) vector could be visualized in the anterior IM (arrow; red line marks the sixth somite border). (B,D) ISH reveals specific IM anterior expansion of Lim1 expression only in embryos electroporated with the Hoxb4 expression vector (arrowhead in D), and not in embryos expressing the control vector (B). (E) Cross-section through the region indicated by the arrowhead in D showing that Lim1 expansion is specific to the IM of the experimental side (arrow). NT, neural tube; s, somite. Scale bars: 100 μm.
Fig. 6.
Activin or activin-like signaling is necessary but insufficient for_Lim1_ induction in IM cells. (A-H) Hoxb4 expression vector driving IRES2-dsRed expression was co-electroporated with pCIG control vector (A-D) or with dnXAR1 expression vector driving IRES2-GFP expression (E-H) into the prospective IM region of PS3. The red line marks the sixth somite border. (A,E) Eighteen hours after electroporation, expression of dsRed could be visualized in both anterior (arrows) and posterior IM. GFP expression marks the location of the control vector (B) or of dnXAR1 expression (F). (C,G) Merged images of Hoxb4 expression together with the control (C) or dnXAR1 (G) vector. (D) ISH for Lim1 reveals specific IM anterior expansion of expression (arrowhead) in cells that express Hoxb4 together with the control vector. (H) No anterior expansion of Lim1 was detected in the IM of embryos co-expressing Hoxb4 and dnXAR1 (open arrowhead), and the endogenous expression of Lim1 in the posterior IM was diminished (white arrowhead). (I,J) The embryo in H was cross-sectioned at the indicated levels and immunostained using anti-GFP antibodies. Merged fields are shown. (I) An anterior cross-section shows that IM cells expressing dnXAR1 (represented by GFP staining) do not express_Lim1_ (open arrowhead). (J) A posterior cross-section shows that IM cells expressing dnXAR1 do not express endogenous Lim1 (white arrowhead) as compared with IM cells on the contralateral side. (K) Two parallel IM6 regions were isolated and cultured for 24 hours with or without 10 ng/ml activin. Expression of Lim1, Hoxb4 and Gapdh was analyzed by RT-PCR. NT, neural tube; s, somite. Scale bars: 100 μm.
Fig. 7.
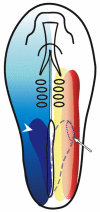
Scheme illustrating the molecules that constitute the kidney morphogenetic field in a stage 8 chick embryo. The overlap between three different morphogen gradients determines the domain of kidney gene expression. Red illustrates the lateral-medial gradient of BMP signaling, yellow the mediolateral gradient of activin-like signaling, and blue the posterior-anterior gradient of RA that generates the expression domain of_Hoxb4_ (dark-blue domain on the left side, arrowhead). The kidney morphogenetic field (dotted line, arrow) is established in the overlapping domain of BMP and activin-like signaling and Hoxb4 expression (dashed line on the right).
Similar articles
- Analysis of nephric duct specification in the avian embryo.
Attia L, Yelin R, Schultheiss TM. Attia L, et al. Development. 2012 Nov;139(22):4143-51. doi: 10.1242/dev.085258. Epub 2012 Oct 3. Development. 2012. PMID: 23034630 Free PMC article. - Regulation of Hoxb4 induction after neurulation by somite signal and neural competence.
Amirthalingam GS, Howard S, Alvarez S, de Lera AR, Itasaki N. Amirthalingam GS, et al. BMC Dev Biol. 2009 Feb 25;9:17. doi: 10.1186/1471-213X-9-17. BMC Dev Biol. 2009. PMID: 19243620 Free PMC article. - Cell fate specification along the anterior-posterior axis of the intermediate mesoderm.
Barak H, Rosenfelder L, Schultheiss TM, Reshef R. Barak H, et al. Dev Dyn. 2005 Apr;232(4):901-14. doi: 10.1002/dvdy.20263. Dev Dyn. 2005. PMID: 15759277 - How the embryo makes a limb: determination, polarity and identity.
Tickle C. Tickle C. J Anat. 2015 Oct;227(4):418-30. doi: 10.1111/joa.12361. Epub 2015 Aug 7. J Anat. 2015. PMID: 26249743 Free PMC article. Review. - Bone morphogenetic proteins.
Chen D, Zhao M, Mundy GR. Chen D, et al. Growth Factors. 2004 Dec;22(4):233-41. doi: 10.1080/08977190412331279890. Growth Factors. 2004. PMID: 15621726 Review.
Cited by
- Analysis of nephric duct specification in the avian embryo.
Attia L, Yelin R, Schultheiss TM. Attia L, et al. Development. 2012 Nov;139(22):4143-51. doi: 10.1242/dev.085258. Epub 2012 Oct 3. Development. 2012. PMID: 23034630 Free PMC article. - Retinoid and TGF-β families: crosstalk in development, neoplasia, immunity, and tissue repair.
Xu Q, Kopp JB. Xu Q, et al. Semin Nephrol. 2012 May;32(3):287-94. doi: 10.1016/j.semnephrol.2012.04.008. Semin Nephrol. 2012. PMID: 22835460 Free PMC article. Review. - Evolutionary Transition in the Regulation of Vertebrate Pronephros Development: A New Role for Retinoic Acid.
Schmidt P, Leman E, Lagadec R, Schubert M, Mazan S, Reshef R. Schmidt P, et al. Cells. 2022 Apr 12;11(8):1304. doi: 10.3390/cells11081304. Cells. 2022. PMID: 35455988 Free PMC article. - Patterning a complex organ: branching morphogenesis and nephron segmentation in kidney development.
Costantini F, Kopan R. Costantini F, et al. Dev Cell. 2010 May 18;18(5):698-712. doi: 10.1016/j.devcel.2010.04.008. Dev Cell. 2010. PMID: 20493806 Free PMC article. Review. - Advances in early kidney specification, development and patterning.
Dressler GR. Dressler GR. Development. 2009 Dec;136(23):3863-74. doi: 10.1242/dev.034876. Development. 2009. PMID: 19906853 Free PMC article. Review.
References
- Barak, H., Rosenfelder, L., Schultheiss, T. M. and Reshef, R. (2005). Cell fate specification along the anterior-posterior axis of the intermediate mesoderm. Dev. Dyn. 232, 901-914. - PubMed
- Bel-Vialar, S., Itasaki, N. and Krumlauf, R. (2002). Initiating Hox gene expression: in the early chick neural tube differential sensitivity to FGF and RA signaling subdivides the HoxB genes in two distinct groups. Development 129, 5103-5115. - PubMed
- Cartry, J., Nichane, M., Ribes, V., Colas, A., Riou, J. F., Pieler, T., Dolle, P., Bellefroid, E. J. and Umbhauer, M. (2006). Retinoic acid signalling is required for specification of pronephric cell fate. Dev. Biol. 299, 35-51. - PubMed
- Connolly, D. J., Patel, K., Seleiro, E. A., Wilkinson, D. G. and Cooke, J. (1995). Cloning, sequencing, and expressional analysis of the chick homologue of follistatin. Dev. Genet. 17, 65-77. - PubMed
- Czerny, T., Bouchard, M., Kozmik, Z. and Busslinger, M. (1997). The characterization of novel Pax genes of the sea urchin and Drosophila reveal an ancient evolutionary origin of the Pax2/5/8 subfamily. Mech. Dev. 67, 179-192. - PubMed
Publication types
MeSH terms
Substances
LinkOut - more resources
Full Text Sources
Other Literature Sources


