Autoinhibitory interactions between the PDZ2 and C-terminal domains in the scaffolding protein NHERF1 - PubMed (original) (raw)
Autoinhibitory interactions between the PDZ2 and C-terminal domains in the scaffolding protein NHERF1
Hong Cheng et al. Structure. 2009.
Abstract
Na(+)/H(+) exchanger regulatory factor (NHERF1) is a signaling adaptor protein comprising two PDZ domains and a C-terminal ezrin-binding (EB) motif. To understand the role of intramolecular interactions in regulating its binding properties, we characterized the complex between the second PDZ domain PDZ2 and the C-terminal 242-358 fragment of NHERF1 using NMR and fluorescence methods. NMR chemical shift and relaxation data implicate 11 C-terminal residues in binding and, together with a thermodynamic analysis of mutant proteins, indicate that the EB region becomes helical when bound to PDZ2. Both specific contacts between PDZ2 and EB as well as nonspecific interactions involving a 100-residue flexible linker contribute to stabilizing two structurally distinct closed conformations of NHERF1. The affinity of mutant proteins for an extrinsic ligand is inversely related to the helix-forming propensity of the EB motif. The findings provide a structural framework for understanding how autoinhibitory interactions modulated the binding properties of NHERF1.
Figures
Figure 1. Domain structure of NHERF1 and 3D structure of PDZ domains
(A) A linear representation of the domain structure of NHERF1. (B) Backbone overlay of NMR solution structures of NHERF1 PDZ2 (12 structures with lowest number of restraint violations). Ramachandran plot analysis of the final structures showed 64%, 30%, 6% and 0% for most favorable, additionally allowed, generously allowed and disallowed regions, respectively (excluding Gly). (C) Ribbon representation of NMR structure of PDZ2. (D) Comparison of the backbone structures of NHERF1 PDZ1 (blue) and NHERF1 PDZ2 (magenta).
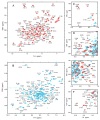
Figure 2. NMR evidence for inter- and intra-molecular interactions between PDZ2 and CT
(A) HSQC at 15 °C of 15N-labeled PDZ2 in 20 mM HEPES and 150 mM NaCl, pH 7.5. (B) Transverse relaxation-optimized NMR spectrum (TROSY) at 30 °C of PDZ2-CT in 20 mM HEPES and 150 mM NaCl, pH 7.5. (C–F) Expanded regions from HSQC spectra at 20 °C of 15N-labeled PDZ2 (red), equimolar complex of 15N-labeled PDZ2 and unlabeled CT (orange), and PDZ2-CT (cyan) in 20 mM HEPES and 150 mM NaCl, pH 7.5. Assignments for PDZ2 are indicated.
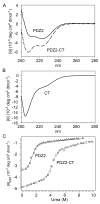
Figure 3. Secondary structure and stability of PDZ2, CT and PDZ2-CT
CD spectra of (A) PDZ2 at 15 °C (solid line) and PDZ2-CT at 20 °C (dashed line); and (B) CT at 15 °C. (C) Urea unfolding of PDZ2 and PDZ2-CT monitored by using CD at 222 nm at 15 °C. The lines represent a two-state fit of the data for PDZ2 (Cm=1.25±0.33 M, m = 1.41±0.13 kcal mol−1 M−1; ΔG0=1.76±0.46 kcal mol−1) and PDZ2-CT (Cm=4.18±0.03 M, m = 1.6±0.11 kcal mol−1 M−1; ΔG0=6.69±0.15 kcal mol−1), respectively.
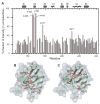
Figure 4. Residues on PDZ2 interacting with the EB region
(A) Fractional intensity change in percent (complex/free) from the 15N relaxation dispersion reference spectra (without CPMG sequences) recorded on free PDZ2 (1.51 mM) and PDZ2 (1.46 mM) in the presence of CT (0.032 mM). Unassigned residues (Y164, S170, and K172) and those with overlapping peaks in the spectrum of the complex (A190, I199, V202, and M207) are not shown. (B) Ribbon diagram of the NMR structure of PDZ2 with a surface plot in the background. Residues with more than 50% intensity change are shown as ball-and-stick in red. S162, the phosphorylation site in the PDZ2 alone, is shown as ball-and-stick in yellow. (C) Ribbon diagram surface plot of the NMR structure of PDZ2 showing homologous side chains in PDZ1 involved in interactions with the peptide DEQL [19].
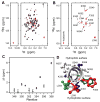
Figure 5. NMR evidence that PDZ2 binds the C-terminal EB region in a helical conformation
1H-15N HSQC spectra of 15N-labeled CT (242–358). (A) The superimposed spectra of HSQC of 15N-labeled CT (red) and HSQC of 15N-labeled CT (0.53 mM)/unlabeled PDZ2 (0.53 mM) equimolar complex (black); (B) The difference spectrum obtained by subtracting HSQC of 15N CT from that of equimolar 15N-labeled CT/unlabeled PDZ2 complex (red: positive contours; black: negative contours). The spectra of free and complex were normalized based on the intensities of the peak with an arrow in (A). (C) Chemical shift changes due to binding of 15N-labeled CT to unlabeled PDZ2 derived from relaxation dispersion measurements (Figure S3), including 10 of the last 11 residues at the C-terminal of NHERF1. (D) C-terminal helix of the NHERF1 peptide (346–358) as observed in the crystal structure of the FERM-NHERF1 complex [25]. The side chains are shown in ball-and-stick representation. F355 and L358 (red) are involved in binding to PDZ2 and FERM. M346, W348, and L354 (green) are involved in binding to FERM only. K350, K351, and S356 (blue) are important in the binding to PDZ2 only.
Figure 6. Effect of mutations in the EB region of NHERF1 on the three-state unfolding equilibrium of PDZ2-CT
observed by global analysis of the fluorescence emission spectra vs. urea concentration (Supplemental Data, Figure S4). In panels (A) and (B) the populations of the three predominant equilibrium states, N (solid), I (dashed) and U (dash-dot), are plotted vs. urea concentrations for PDZ-CT and three variants. (C) Intrinsic tyrosine fluorescence spectra of the I-state (normalized relative to the emission maximum of the N-state) for WT PDZ2-CT and three variants. (D) Bar graph showing the effect of mutations on the free energy of the N ⇔ I transition (Δ ΔG1, hatched) and the I ⇔ U unfolding transition (Δ ΔG2). Free energy changes were calculated at the Cm1/2 values of WT PDZ2-CT, using the transition parameters in Table 1.
Figure 7. Schematic diagram of the various conformational states populated in the unfolding equilibrium of PDZ2-CT
, including the native state (N) populated in the absence of denaturant, a state with the C-terminal EB helix interacting with PDZ2 (IEB), an open state in which only the PDZ domain is folded (Iopen), and the fully unfolded ensemble (U).
Similar articles
- Structural basis for NHERF1 PDZ domain binding.
Mamonova T, Kurnikova M, Friedman PA. Mamonova T, et al. Biochemistry. 2012 Apr 10;51(14):3110-20. doi: 10.1021/bi201213w. Epub 2012 Mar 27. Biochemistry. 2012. PMID: 22429102 Free PMC article. - A conformational switch in the scaffolding protein NHERF1 controls autoinhibition and complex formation.
Bhattacharya S, Dai Z, Li J, Baxter S, Callaway DJE, Cowburn D, Bu Z. Bhattacharya S, et al. J Biol Chem. 2010 Mar 26;285(13):9981-9994. doi: 10.1074/jbc.M109.074005. Epub 2009 Dec 30. J Biol Chem. 2010. PMID: 20042604 Free PMC article. - Dynamic structure of the full-length scaffolding protein NHERF1 influences signaling complex assembly.
Bhattacharya S, Stanley CB, Heller WT, Friedman PA, Bu Z. Bhattacharya S, et al. J Biol Chem. 2019 Jul 19;294(29):11297-11310. doi: 10.1074/jbc.RA119.008218. Epub 2019 Jun 6. J Biol Chem. 2019. PMID: 31171716 Free PMC article. - Noncanonical Sequences Involving NHERF1 Interaction with NPT2A Govern Hormone-Regulated Phosphate Transport: Binding Outside the Box.
Mamonova T, Friedman PA. Mamonova T, et al. Int J Mol Sci. 2021 Jan 22;22(3):1087. doi: 10.3390/ijms22031087. Int J Mol Sci. 2021. PMID: 33499384 Free PMC article. Review. - Roles of NHERF1/EBP50 in cancer.
Georgescu MM, Morales FC, Molina JR, Hayashi Y. Georgescu MM, et al. Curr Mol Med. 2008 Sep;8(6):459-68. doi: 10.2174/156652408785748031. Curr Mol Med. 2008. PMID: 18781953 Review.
Cited by
- Ezrin-anchored protein kinase A coordinates phosphorylation-dependent disassembly of a NHERF1 ternary complex to regulate hormone-sensitive phosphate transport.
Wang B, Means CK, Yang Y, Mamonova T, Bisello A, Altschuler DL, Scott JD, Friedman PA. Wang B, et al. J Biol Chem. 2012 Jul 13;287(29):24148-63. doi: 10.1074/jbc.M112.369405. Epub 2012 May 24. J Biol Chem. 2012. PMID: 22628548 Free PMC article. - Organizing the cell cortex: the role of ERM proteins.
Fehon RG, McClatchey AI, Bretscher A. Fehon RG, et al. Nat Rev Mol Cell Biol. 2010 Apr;11(4):276-87. doi: 10.1038/nrm2866. Nat Rev Mol Cell Biol. 2010. PMID: 20308985 Free PMC article. Review. - Role of the PDZ-scaffold protein NHERF1/EBP50 in cancer biology: from signaling regulation to clinical relevance.
Vaquero J, Nguyen Ho-Bouldoires TH, Clapéron A, Fouassier L. Vaquero J, et al. Oncogene. 2017 Jun 1;36(22):3067-3079. doi: 10.1038/onc.2016.462. Epub 2017 Jan 9. Oncogene. 2017. PMID: 28068322 Review. - Plasticity of PDZ domains in ligand recognition and signaling.
Ivarsson Y. Ivarsson Y. FEBS Lett. 2012 Aug 14;586(17):2638-47. doi: 10.1016/j.febslet.2012.04.015. Epub 2012 Apr 21. FEBS Lett. 2012. PMID: 22576124 Free PMC article. Review. - Structural basis for NHERF1 PDZ domain binding.
Mamonova T, Kurnikova M, Friedman PA. Mamonova T, et al. Biochemistry. 2012 Apr 10;51(14):3110-20. doi: 10.1021/bi201213w. Epub 2012 Mar 27. Biochemistry. 2012. PMID: 22429102 Free PMC article.
References
- Hall RA, Ostedgaard LS, Premont RT, Blitzer JT, Rahman N, Welsh MJ, Lefkowitz RJ. A C-terminal motif found in the beta2-adrenergic receptor, P2Y1 receptor and cystic fibrosis transmembrane conductance regulator determines binding to the Na+/H+ exchanger regulatory factor family of PDZ proteins. Proc Natl Acad Sci U S A. 1998;95:8496–8501. - PMC - PubMed
- Weinman EJ, Hall RA, Friedman PA, Liu-Chen LY, Shenolikar S. The association of NHERF adaptor proteins with g protein-coupled receptors and receptor tyrosine kinases. Annu Rev Physiol. 2006;68:491–505. - PubMed
- Guggino WB, Stanton BA. New insights into cystic fibrosis: molecular switches that regulate CFTR. Nat Rev Mol Cell Biol. 2006;7:426–436. - PubMed
- Mahon MJ, Donowitz M, Yun CC, Segre GV. Na(+)/H(+ ) exchanger regulatory factor 2 directs parathyroid hormone 1 receptor signalling. Nature. 2002;417:858–861. - PubMed
Publication types
MeSH terms
Substances
Grants and funding
- CA06927/CA/NCI NIH HHS/United States
- R01 GM056250-11/GM/NIGMS NIH HHS/United States
- P30 CA006927-46/CA/NCI NIH HHS/United States
- P30 CA006927/CA/NCI NIH HHS/United States
- R01 HL086496-02/HL/NHLBI NIH HHS/United States
- R01 GM056250/GM/NIGMS NIH HHS/United States
- GM056250/GM/NIGMS NIH HHS/United States
- R01 HL086496/HL/NHLBI NIH HHS/United States
LinkOut - more resources
Full Text Sources
Molecular Biology Databases
Miscellaneous


