A role for casein kinase 2 in the mechanism underlying circadian temperature compensation - PubMed (original) (raw)
A role for casein kinase 2 in the mechanism underlying circadian temperature compensation
Arun Mehra et al. Cell. 2009.
Abstract
Temperature compensation of circadian clocks is an unsolved problem with relevance to the general phenomenon of biological compensation. We identify casein kinase 2 (CK2) as a key regulator of temperature compensation of the Neurospora clock by determining that two long-standing clock mutants, chrono and period-3, displaying distinctive alterations in compensation encode the beta1 and alpha subunits of CK2, respectively. Reducing the dose of these subunits, particularly beta1, significantly alters temperature compensation without altering the enzyme's Q(10). By contrast, other kinases and phosphatases implicated in clock function do not play appreciable roles in temperature compensation. CK2 exerts its effects on the clock by directly phosphorylating FREQUENCY (FRQ), and this phosphorylation is compromised in CK2 hypomorphs. Finally, mutation of certain putative CK2 phosphosites on FRQ, shown to be phosphorylated in vivo, predictably alters temperature compensation profiles effectively phenocopying CK2 mutants.
Figures
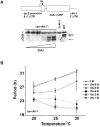
Figure 1. chrono and period-3 bear mutations in CK2 subunits
(A) The TC profiles of chr and prd-3 are shown. Epistasis between chr and prd-3 is observed with respect to TC and presence or absence of clear banding at 30°C. Values are the mean of N=3 race tubes ± SD. See also Fig. 2 in Gardner and Feldman (1981) for single mutant TC curves. (B) SNP mapping of chr reveals linkage to a SNP on supercontig 311 (Neurospora genome release 3) of linkage group (LG) VI. Genetic data, shown as distance in cM between chr and the indicated SNP (open circles), were consistent with a location for chr on the end of 311, a position occupied by ckb-1. (C) Mapping localizes prd-3 approximately equidistant between SNPs 164a and 164b. This location was used to identify a series of pLORIST cosmids (horizontal lines) spanning the region. Transformation of these into prd-3 recipients revealed rescue only by pLORIST H031 B12. Predicted ORFs within this cosmid included cka (grey box).
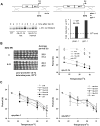
Figure 2. Heterokaryon knockdowns of cka and ckb-1 resemble prd-3 and chr respectively
(A) Reduction of cka dosage in heterokaryons increases period lengths and extends TC. TC profiles of WT (circles), prd-3 (large triangles) and 7 independent Δ_cka_ heterokaryons (small triangles) are depicted ± SD, reflecting analysis of of 3-6 bands in a single race tube. (B) Reduction of ckb-1 dosage in heterokaryons reduces period length and results in enhanced TC. TC profiles of WT (circles), chr (large squares) and 8 independent Δ_chr_ heterokaryons (small squares) are depicted ± SD, reflecting analysis of 3-6 bands in a single race tube. Heterokaryons that overcompensate across the temperature range are shown with dotted lines. (C) Four independent Δ_ckb-1_ homokaryons display an arrhythmic phenotype whereas two WT sibling controls have a normal phenotype.
Figure 3. CKB-1 dose determines TC type
(A) Quinic acid-inducible CKB-1. (Top) The schematic depicts a quinic acid (QA) inducible promoter, qa 5’ UTR (thin bar), and transcriptional start site (tss, arrow) driving the predicted ckb-1 gene including ORF (thick bar), introns (line) and 3’ genomic sequences (thin line). This construct was targeted to the his-3 locus in a his-3; Δ_ckb-1_ homokaryon. (Bottom) Antiserum to CKB-1 was used to examine the WT, Δ_ckb-1_ homokaryon and one qa-ckb-1 heterokaryon transformant. Tissue was collected from liquid cultures induced for ~13 h with different QA concentrations (0 to 10-1 M, wedge); equal amounts of protein were loaded. Arrows depict CKB-1 isoforms similar to those seen in the WT. (B) Dosage of WT CKB-1 dictates the form of TC ranging from undercompensation, to extended-range TC, to overcompensation. TC profiles were determined by analysis of transformed heterokaryons run on race tubes containing increasing concentrations of quinic acid (0 M to 10-1 M). Period lengths were determined from N=5-6 replicate race tubes (each race tube had at least 4 bands) bearing one of two independent transformants (2-3 race tubes each), run at the indicated temperatures. Period lengths are mean period ± SD.
Figure 4. Reduced dosages of phosphatases and kinases previously implicated in the N. crassa clock, other than CK2, alter period length but do not significantly alter TC
(A) (Top) Schematic of the knock-in strategy used to assess the effects of reduced dosage of a phosphatase and kinases other than CK2. A bialaphos resistance gene (bar) was fused to between ~600 bp (left panel) and ~1100 bp (right panel) of DNA upstream from the qa ATG which is ~70 bp downstream of the qa transcriptional start site (arrow, tss). This was targeted to the endogenous promoters of various phosphatase or kinase genes by homologous recombination (dashed lines), thereby replacing the endogenous promoter and 5′ UTR with the promoter and 5′ UTR of the quinic acid-inducible qa gene. (Bottom left) Protein induced by addition of 10-2 M QA for the indicated time was checked by α-CK-1a Ab. (Bottom right) Assessment of steady state mRNA using quantitative RT-PCR for the indicated strains—values are plotted as fold-induction versus WT controls (dotted line) from representative experiments. (B) ck-1a dramatically affects period length but not TC. (Left) Independent lines of endogenous qa-ck-1a heterokaryons have increased period lengths in the absence of QA. Addition of 10-2 M QA causes these to revert to the WT period length of 22.3 ± 0.0 h, N=6 race tubes. (Right) Dosage of ck-1a does not strongly influence the TC profile. Endogenous qa-ck-1a homokaryons show increased period lengths at all temperatures as a function of QA but TC profiles remain similar to WT. Data are plotted as the mean period length determined from N=6 race tubes ± SD (two independent lines). (C) Changing pkac-1 or pph-1 levels has subtle effects on period length but no effect on TC. Neither qa-pkac-1 homokaryons (left panel) nor qa-pph-1 homokaryons (right panel) show significant deviations from a WT TC profile. A representative WT is re-plotted from (B) for reference. Data are plotted as the mean period length determined from N=6 (for WT) and N=3 replicate race tubes ± SD for the other genotypes and N=2 replicates in a few cases.
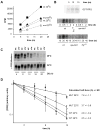
Figure 5. CK2 directly phosphorylates FRQ in a CKB-1-dependent manner, and exhibits normal temperature sensitivity across a range of ckb-1 expresssion
(A) The Q10 of the kinase acting on a synthetic peptide substrate does not change when CK2β1 is expressed at a low dose. Plotted are scintillation counts from kinase reactions (WT extracts, squares or qa-ckb-1 extracts, ‘mut’ triangles) grown at indicated temperatures (30°C, filled symbols or 20°C, open symbols). The slopes of the lines reflect the rate of phosphorylation. (B) Direct phosphorylation of FRQ by CK2. (Top) GST-FRQ is directly phosphorylated by CK2. Phosphorimaging of in vitro kinase reactions from WT whole cell extracts on purified GST-FRQ with radioactive GTP reveals radio-labeled bands at the predicted size of GST-FRQ. (Bottom) Endogenous FRQ is phosphorylated by CK2. Whole cell extracts from the indicated strains were incubated at 30°C for the indicated times with radioactive GTP. Phosphorimaging of gels bearing α-FRH immunoprecipitations reveals bands at the predicted size of FRQ only from the WT reactions. The two lower images are from two different experiments varying the total protein and time of incubation. (C) α-FRQ Western blots in WT and chrono (chr) mutant strains. Cultures were shifted from 4°C to the temperatures indicated on the right. FRQ phosphorylation and degradation is observed as a function of time in DD (hours after transfer from cold to warm). (D) (Left) Degradation profiles of FRQ protein in WT (circles) and the ckb-1 inducible strain (MUT, squares). Cultures were transferred from 6 h in constant light to dark at the indicated temperatures and were collected at the indicated times. NIH Image densitometry profiles of non-saturated α-FRQ autoradiographs for samples between DD 2-12 h were plotted on a log-linear scale and fitted to exponential decay functions. Data points represent the Coomassie-normalized, Western blot densitometric means of N=2-3 replicates ± SD. (Right) Calculated FRQ half-lives ± SD in the indicated strain and temperature. The half-life for WT FRQ is consistent with previously published estimates (Ruoff et al., 2005).
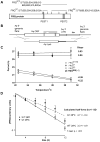
Figure 6. Mutations in FRQ can phenocopy CK2 hypomorphs
(A) A schematic representation (to scale) of FRQ depicting the positions of two groups of serines that have been altered to alanines (vertical lines). FRQQ1 (short horizontal line) bears a tight cluster of mutations around PEST1 (Aronson et al., 1994; Gorl et al., 2001). FRQQ2 has a broader distribution of mutations in the C-terminus of the protein (intermediate horizontal line). FRQQ12 (long horizontal line) bears all eight changes. (B) A schematic representation (roughly to scale) of the frq replacement strategy. The transforming construct (top) re-introduces frq into a hygromycin phosphotransferase (hph)-bearing KO strain at the endogenous frq locus. (C) A class of putative CK2 phosphosite mutants of FRQ can phenocopy the TC defect of chr. Strains bearing FRQQ1 (grey circles) or FRQQ12 (black circles) show increased period lengths and extended TC. FRQWT-KI and FRQQ2 (squares, white circles respectively) show WT-like TC and period lengths. Values are the mean of N=6 race tubes ± SD. Slopes of a best linear fit are indicated to the right of each series. (D) (Left) Degradation profiles of FRQ protein in frqWT-KI (WT, circles) and the frqQ1 strain (Q1, squares). Cultures were transferred from 6 h in constant light to dark at the indicated temperatures and were collected at the indicated times. NIH Image densitometry profiles of non-saturated α-FRQ autoradiographs were plotted on a log-linear scale and fitted to exponential decay functions between DD 2-12 h. Data points represent the Coomassie-normalized, Western blot densitometric means of N=3 replicates ± SD. (Right) Calculated FRQ half-lives ± SD in the indicated strain and temperature. A two-tailed T-test indicates a significant difference between mean half-lives.
Figure 7. Model of FRQ phosphosite heterogeneity
Multiple classes of phosphorylation on FRQ are depicted. One type, CK1 target(s), leads to temperature-independent association of degradation co-factors, (not depicted). Additionally, other CK1 phosphosite(s) promote WCC formation. Meanwhile, while some CK2 phosphosite phosphorylation promotes degradation at all temperatures, other sites (near PEST1) facilitate degradation of FRQ preferentially at higher temperatures.
Comment in
- Keeping the beat in the rising heat.
Virshup DM, Forger DB. Virshup DM, et al. Cell. 2009 May 15;137(4):602-4. doi: 10.1016/j.cell.2009.04.051. Cell. 2009. PMID: 19450508
Similar articles
- FRQ-CK1 Interaction Underlies Temperature Compensation of the Neurospora Circadian Clock.
Hu Y, Liu X, Lu Q, Yang Y, He Q, Liu Y, Liu X. Hu Y, et al. mBio. 2021 Jun 29;12(3):e0142521. doi: 10.1128/mBio.01425-21. Epub 2021 Jun 29. mBio. 2021. PMID: 34182774 Free PMC article. - Keeping the beat in the rising heat.
Virshup DM, Forger DB. Virshup DM, et al. Cell. 2009 May 15;137(4):602-4. doi: 10.1016/j.cell.2009.04.051. Cell. 2009. PMID: 19450508 - Loss of temperature compensation of circadian period length in the frq-9 mutant of Neurospora crassa.
Loros JJ, Feldman JF. Loros JJ, et al. J Biol Rhythms. 1986 Fall;1(3):187-98. doi: 10.1177/074873048600100302. J Biol Rhythms. 1986. PMID: 2980965 - Casein kinase 2, circadian clocks, and the flight from mutagenic light.
Allada R, Meissner RA. Allada R, et al. Mol Cell Biochem. 2005 Jun;274(1-2):141-9. doi: 10.1007/s11010-005-2943-1. Mol Cell Biochem. 2005. PMID: 16335534 Review. - Post-translational modifications regulate the ticking of the circadian clock.
Gallego M, Virshup DM. Gallego M, et al. Nat Rev Mol Cell Biol. 2007 Feb;8(2):139-48. doi: 10.1038/nrm2106. Nat Rev Mol Cell Biol. 2007. PMID: 17245414 Review.
Cited by
- Label-free quantitative analysis of the casein kinase 2-responsive phosphoproteome of the marine minimal model species Ostreococcus tauri.
Le Bihan T, Hindle M, Martin SF, Barrios-Llerena ME, Krahmer J, Kis K, Millar AJ, van Ooijen G. Le Bihan T, et al. Proteomics. 2015 Dec;15(23-24):4135-44. doi: 10.1002/pmic.201500086. Epub 2015 Jun 9. Proteomics. 2015. PMID: 25930153 Free PMC article. - Host-Induced Silencing of Fusarium graminearum Genes Enhances the Resistance of Brachypodium distachyon to Fusarium Head Blight.
He F, Zhang R, Zhao J, Qi T, Kang Z, Guo J. He F, et al. Front Plant Sci. 2019 Oct 30;10:1362. doi: 10.3389/fpls.2019.01362. eCollection 2019. Front Plant Sci. 2019. PMID: 31737001 Free PMC article. - Post-translational modifications in circadian rhythms.
Mehra A, Baker CL, Loros JJ, Dunlap JC. Mehra A, et al. Trends Biochem Sci. 2009 Oct;34(10):483-90. doi: 10.1016/j.tibs.2009.06.006. Epub 2009 Sep 7. Trends Biochem Sci. 2009. PMID: 19740663 Free PMC article. Review. - Thermal robustness of signaling in bacterial chemotaxis.
Oleksiuk O, Jakovljevic V, Vladimirov N, Carvalho R, Paster E, Ryu WS, Meir Y, Wingreen NS, Kollmann M, Sourjik V. Oleksiuk O, et al. Cell. 2011 Apr 15;145(2):312-21. doi: 10.1016/j.cell.2011.03.013. Cell. 2011. PMID: 21496648 Free PMC article. - FRQ-CK1 Interaction Underlies Temperature Compensation of the Neurospora Circadian Clock.
Hu Y, Liu X, Lu Q, Yang Y, He Q, Liu Y, Liu X. Hu Y, et al. mBio. 2021 Jun 29;12(3):e0142521. doi: 10.1128/mBio.01425-21. Epub 2021 Jun 29. mBio. 2021. PMID: 34182774 Free PMC article.
References
- Akten B, Jauch E, Genova GK, Kim EY, Edery I, Raabe T, Jackson FR. A role for CK2 in the Drosophila circadian oscillator. Nat Neurosci. 2003;6:251–257. - PubMed
- Allada R, Emery P, Takahashi JS, Rosbash M. Stopping time: the genetics of fly and mouse circadian clocks. Annu Rev Neurosci. 2001;24:1091–1119. - PubMed
- Allada R, Meissner RA. Casein kinase 2, circadian clocks, and the flight from mutagenic light. Mol Cell Biochem. 2005;274:141–149. - PubMed
Publication types
MeSH terms
Substances
Grants and funding
- R01 GM034985/GM/NIGMS NIH HHS/United States
- R01 GM083336-20/GM/NIGMS NIH HHS/United States
- P01 GM068087/GM/NIGMS NIH HHS/United States
- P01 GM068087-05/GM/NIGMS NIH HHS/United States
- P01 GM68087/GM/NIGMS NIH HHS/United States
- R01 GM34985/GM/NIGMS NIH HHS/United States
- R01 GM034985-23/GM/NIGMS NIH HHS/United States
- R01 GM083336/GM/NIGMS NIH HHS/United States
LinkOut - more resources
Full Text Sources


