Osteopontin promotes fibrosis in dystrophic mouse muscle by modulating immune cell subsets and intramuscular TGF-beta - PubMed (original) (raw)
. 2009 Jun;119(6):1583-94.
doi: 10.1172/JCI37662. Epub 2009 May 18.
Affiliations
- PMID: 19451692
- PMCID: PMC2689112
- DOI: 10.1172/JCI37662
Osteopontin promotes fibrosis in dystrophic mouse muscle by modulating immune cell subsets and intramuscular TGF-beta
Sylvia A Vetrone et al. J Clin Invest. 2009 Jun.
Abstract
Duchenne muscular dystrophy (DMD) is an X-linked, degenerative muscle disease that is exacerbated by secondary inflammation. Here, we characterized the immunological milieu of dystrophic muscle in mdx mice, a model of DMD, to identify potential therapeutic targets. We identified a specific subpopulation of cells expressing the Vbeta8.1/8.2 TCR that is predominant among TCR-beta+ T cells. These cells expressed high levels of osteopontin (OPN), a cytokine that promotes immune cell migration and survival. Elevated OPN levels correlated with the dystrophic process, since OPN was substantially elevated in the serum of mdx mice and muscle biopsies after disease onset. Muscle biopsies from individuals with DMD also had elevated OPN levels. To test the role of OPN in mdx muscle, mice lacking both OPN and dystrophin were generated and termed double-mutant mice (DMM mice). Reduced infiltration of NKT-like cells and neutrophils was observed in the muscle of DMM mice, supporting an immunomodulatory role for OPN in mdx muscle. Concomitantly, an increase in CD4+ and FoxP3+ Tregs was also observed in DMM muscle, which also showed reduced levels of TGF-beta, a known fibrosis mediator. These inflammatory changes correlated with increased strength and reduced diaphragm and cardiac fibrosis. These studies suggest that OPN may be a promising therapeutic target for reducing inflammation and fibrosis in individuals with DMD.
Figures
Figure 1. Characterization of inflammatory cytokines in mdx muscle and spleen.
Cytokine mRNA expression was assessed by QPCR in C57BL/6 (C57) and mdx quadriceps muscles at (A) 4 weeks of age (n = 4) and (B) 6 months of age (n = 4). Expression was normalized to GAPDH mRNA. (C) Cytokine secretion was assessed in C57BL/6 and mdx splenocytes by ELISPOT. Data are presented as average (avg) values. Error bars represent SEM (A and B). *P ≤ 0.05, **P ≤ 0.01.
Figure 2. Vβ8.1/8.2 is the predominant Vβ TCR rearrangement in mdx muscle.
Infiltrating leukocytes were extracted, purified, and pooled from all skeletal muscles of 4-week-old mdx mice, stained with various mouse Vβ TCR antibodies, and analyzed by flow cytometry. A representative experiment showing the distribution of Vβ TCR rearrangements of leukocytes isolated from muscle (A) and spleen (B) is shown. A clear bias toward the Vβ8.1/8.2 TCR rearrangement is observed in leukocytes isolated from muscle that is not seen in those isolated from the spleen. (C) Leukocytes, extracted, purified, and pooled from skeletal muscle of four 4-week-old mdx mice, were sorted by FACS into 2 populations, Vβ8.1/8.2– and Vβ8.1/8.2+, and RT-PCR for Opn mRNA expression was carried out. PCR was also carried out on RNA isolated from the quadriceps muscle. (D) Quantitative RT-PCR of OPN using the same sorted samples shown in C. Stimulated Th1 (Th1-stim) and unstimulated Th1 (Th1-unstim) cells are shown as controls. **P ≤ 0.01, as assessed by 2-tailed Student’s t test. Error bars represent SEM (D).
Figure 3. OPN is expressed in immune and muscle cells.
Assessment of cellular distribution of OPN was performed using biopsies from patients with DMD. Cross sections were stained with goat anti-OPN (red) and counter stained with hematoxylin (blue/purple). OPN was observed in both muscle fibers that appeared to be healthy and in clusters of mononucleated cells (B, C, E, and F); thus, OPN is widely expressed in muscle and in immune cells. Negative control sections were stained with goat IgG instead of OPN antibody (A and D). Original magnification of ×20.
Figure 4. OPN levels are elevated in dystrophic muscle and blood.
OPN levels are elevated in mdx mice compared with C57BL/6 controls after disease onset. OPN was assessed by (A) QPCR of quadriceps muscles and (B) Western blot of diaphragm muscles. (C) Densitometry of the Western blot is shown in C. (D) OPN levels are also elevated in mdx blood coincident with the onset of disease, as assessed by ELISA. Data are presented as average values. Error bars represent SEM (A, C, and D). **P ≤ 0.01, as assessed by a 2-tailed Student’s t test.
Figure 5. Ablation of OPN leads to changes in intramuscular inflammatory cells.
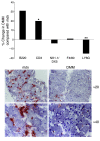
Infiltrating leukocytes were isolated from mdx and DMM mice and characterized by flow cytometry as described in Methods. Each experiment was performed on leukocytes isolated from muscles of 4 grouped 4-week-old mdx or DMM mice, which were stained for cell surface markers and analyzed by flow cytometry. Data represent the percentage difference in DMM muscles of intramuscular inflammatory cells bearing the indicated cell surface markers compared with mdx muscles. Data were assessed from 6–8 experiments per stain. *P ≤ 0.05, **P ≤ 0.01, as assessed by Mann-Whitney U test (top panel). Cross sections of 6-month-old mdx and DMM diaphragm muscles immunostained for Ly6G, a neutrophil marker (red) and counterstained for hematoxylin (blue). Original magnification of ×20 (bottom panel).
Figure 6. Lack of OPN is correlated with a reduction in TGF-β.
(A) Infiltrating leukocytes isolated from mdx and DMM mice were characterized by flow cytometry. Shown in the graph is the CD3+ population (gated from the live cell population) that was analyzed for coexpression of conventional T cell and NK cell markers. The graph shows the percentage difference of subpopulations of CD3+-infiltrating cells between DMM and mdx mice, assessed from 6–8 experiments per stain. (B) QPCR analysis of 4-week-old mdx and DMM quadriceps muscles, using FoxP3 primers (n = 4). (C and D) Cytokine mRNA expression was assessed in mdx and DMM quadriceps muscles at (C) 4 weeks (n = 4) and (D) 6 months of age (n = 4) by QPCR. Expression levels for all QPCR are relative to GAPDH mRNA expression levels. Data are presented as average values. Errors bars represent SEM (B–D). *P ≤ 0.05; **P ≤ 0.01.
Figure 7. mdx mice lacking OPN show improved muscle strength and show an increase in the number of dMHC-positive fibers at 4 weeks of age.
Muscle strength was assessed in mdx and DMM mice at 4 weeks (n = 8 and n = 24, respectively) and 8 weeks (n = 7 and n = 10, respectively) of age, using the wire and grip strength tests. (A) Graph of data obtained in the wire test. (B) Graph of data obtained in the grip strength test. Data were normalized to body weight. (C) Quadriceps muscles of mdx and DMM mice were sectioned and stained with anti-mouse dMHC (n = 8 and n = 16, respectively) at 4 weeks of age. The average number of dMHC-positive fibers was quantitated and normalized per cross-sectional area. (D) Representative sections of mdx and DMM quadriceps stained for dMHC. Original magnification, ×20. Data in graphs are presented as average values. Error bars represent SEM (A–C). *P ≤ 0.05, as assessed by a 2-tailed Student’s t test.
Figure 8. Ablation of OPN correlates with reductions in diaphragm and cardiac fibrosis.
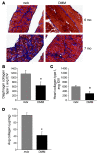
(A) Micrographs show representative trichrome staining of diaphragms from mdx (left panels) and DMM (right panels) animals. The top 2 panels are of 6-month-old mice, whereas bottom 2 panels are of 7-month-old mice. Areas of blue staining indicate proliferation of ECM (i.e., fibrosis), and areas of red staining indicate muscle tissue. Original magnification, ×20. (B) Graph of densitometry of collagen type I Western blots assessed in 6-month-old diaphragms (n = 5–7) and (C) 1-year-old hearts (n = 6–7). IDV, integrated density value. (D) Total collagen was assessed biochemically in 6-month-old diaphragms using the Sircol collagen assay (n = 6–7). Error bars show SEM (B–D). *P ≤ 0.05, as assessed by a 2-tailed Student’s t test.
Similar articles
- Fibrosis and inflammation are greater in muscles of beta-sarcoglycan-null mouse than mdx mouse.
Gibertini S, Zanotti S, Savadori P, Curcio M, Saredi S, Salerno F, Andreetta F, Bernasconi P, Mantegazza R, Mora M. Gibertini S, et al. Cell Tissue Res. 2014 May;356(2):427-43. doi: 10.1007/s00441-014-1854-4. Epub 2014 Apr 11. Cell Tissue Res. 2014. PMID: 24723230 - Osteopontin ablation ameliorates muscular dystrophy by shifting macrophages to a pro-regenerative phenotype.
Capote J, Kramerova I, Martinez L, Vetrone S, Barton ER, Sweeney HL, Miceli MC, Spencer MJ. Capote J, et al. J Cell Biol. 2016 Apr 25;213(2):275-88. doi: 10.1083/jcb.201510086. Epub 2016 Apr 18. J Cell Biol. 2016. PMID: 27091452 Free PMC article. - Immunomodulation of TGF-beta 1 in mdx mouse inhibits connective tissue proliferation in diaphragm but increases inflammatory response: implications for antifibrotic therapy.
Andreetta F, Bernasconi P, Baggi F, Ferro P, Oliva L, Arnoldi E, Cornelio F, Mantegazza R, Confalonieri P. Andreetta F, et al. J Neuroimmunol. 2006 Jun;175(1-2):77-86. doi: 10.1016/j.jneuroim.2006.03.005. Epub 2006 Apr 27. J Neuroimmunol. 2006. PMID: 16647144 - Osteopontin: A Promising Therapeutic Target in Cardiac Fibrosis.
Abdelaziz Mohamed I, Gadeau AP, Hasan A, Abdulrahman N, Mraiche F. Abdelaziz Mohamed I, et al. Cells. 2019 Dec 3;8(12):1558. doi: 10.3390/cells8121558. Cells. 2019. PMID: 31816901 Free PMC article. Review. - Osteopontin and cardiovascular system.
Okamoto H. Okamoto H. Mol Cell Biochem. 2007 Jun;300(1-2):1-7. doi: 10.1007/s11010-006-9368-3. Epub 2006 Nov 30. Mol Cell Biochem. 2007. PMID: 17136480 Review.
Cited by
- Single cell RNA sequencing of human FAPs reveals different functional stages in Duchenne muscular dystrophy.
Fernández-Simón E, Piñol-Jurado P, Gokul-Nath R, Unsworth A, Alonso-Pérez J, Schiava M, Nascimento A, Tasca G, Queen R, Cox D, Suarez-Calvet X, Díaz-Manera J. Fernández-Simón E, et al. Front Cell Dev Biol. 2024 Jul 9;12:1399319. doi: 10.3389/fcell.2024.1399319. eCollection 2024. Front Cell Dev Biol. 2024. PMID: 39045456 Free PMC article. - Increased muscle expression of interleukin-17 in Duchenne muscular dystrophy.
De Pasquale L, D'Amico A, Verardo M, Petrini S, Bertini E, De Benedetti F. De Pasquale L, et al. Neurology. 2012 Apr 24;78(17):1309-14. doi: 10.1212/WNL.0b013e3182518302. Epub 2012 Apr 11. Neurology. 2012. PMID: 22496194 Free PMC article. - Age-Dependent Dysregulation of Muscle Vasculature and Blood Flow Recovery after Hindlimb Ischemia in the mdx Model of Duchenne Muscular Dystrophy.
Podkalicka P, Mucha O, Kaziród K, Bronisz-Budzyńska I, Ostrowska-Paton S, Tomczyk M, Andrysiak K, Stępniewski J, Dulak J, Łoboda A. Podkalicka P, et al. Biomedicines. 2021 Apr 27;9(5):481. doi: 10.3390/biomedicines9050481. Biomedicines. 2021. PMID: 33925757 Free PMC article. - Extracellular vesicles from obese and diabetic mouse plasma alter C2C12 myotube glucose uptake and gene expression.
Pitzer CR, Paez HG, Ferrandi PJ, Mohamed JS, Alway SE. Pitzer CR, et al. Physiol Rep. 2024 Jan;12(1):e15898. doi: 10.14814/phy2.15898. Physiol Rep. 2024. PMID: 38169108 Free PMC article. - Mechanisms of muscle weakness in muscular dystrophy.
Goldstein JA, McNally EM. Goldstein JA, et al. J Gen Physiol. 2010 Jul;136(1):29-34. doi: 10.1085/jgp.201010436. J Gen Physiol. 2010. PMID: 20584890 Free PMC article. No abstract available.
References
Publication types
MeSH terms
Substances
Grants and funding
- P30 AR057230/AR/NIAMS NIH HHS/United States
- R01 AR046911/AR/NIAMS NIH HHS/United States
- T32 GM065823/GM/NIGMS NIH HHS/United States
- R01-AR046911/AR/NIAMS NIH HHS/United States
LinkOut - more resources
Full Text Sources
Other Literature Sources
Molecular Biology Databases
Research Materials


