Migration rules: tumours are conglomerates of self-metastases - PubMed (original) (raw)
Migration rules: tumours are conglomerates of self-metastases
H Enderling et al. Br J Cancer. 2009.
Abstract
Tumours are heterogeneous populations composed of different cells types: stem cells with the capacity for self-renewal and more differentiated cells lacking such ability. The overall growth behaviour of a developing neoplasm is determined largely by the combined kinetic interactions of these cells. By tracking the fate of individual cancer cells using agent-based methods in silico, we apply basic rules for cell proliferation, migration and cell death to show how these kinetic parameters interact to control, and perhaps dictate defining spatial and temporal tumour growth dynamics in tumour development. When the migration rate is small, a single cancer stem cell can only generate a small, self-limited clone because of the finite life span of progeny and spatial constraints. By contrast, a high migration rate can break this equilibrium, seeding new clones at sites outside the expanse of older clones. In this manner, the tumour continually 'self-metastasises'. Counterintuitively, when the proliferation capacity is low and the rate of cell death is high, tumour growth is accelerated because of the freeing up of space for self-metastatic expansion. Changes to proliferation and cell death that increase the rate at which cells migrate benefit tumour growth as a whole. The dominating influence of migration on tumour growth leads to unexpected dependencies of tumour growth on proliferation capacity and cell death. These dependencies stand to inform standard therapeutic approaches, which anticipate a positive response to cell killing and mitotic arrest.
Figures
Figure 1
Cell migration and proliferation. Tumour cells come to occupy adjacent lattice points by two means, migration and proliferation. (A) A cell can randomly migrate to one of the eight adjacent lattice points, if one is available, vacating the original lattice point, or it can proliferate, with a daughter randomly occupying an adjacent lattice point, if one is available (green cell, left panel). If all the eight lattice points contain a cell, a cell attempting to migrate will do nothing, and a cell attempting to divide will become quiescent instead (blue cell, right panel). (B) Proliferation of a cell is ultimately limited by its proliferation capacity. Cancer stem cells (CSCs) have unlimited replicative potential and self-renewing ability. With probability, _p_s, a new CSC is produced, and with probability, 1-_p_s, a non-stem progeny cancer cell is produced that, with each division, loses proliferation capacity until proliferation is exhausted and the cell dies.
Figure 2
Cell life cycle scheme. At each time step, the cell age increases. The cell can migrate, and if maturation age is reached the cell can proliferate, if space is available, or enter quiescence otherwise. If proliferation capacity is exhausted the cell dies; otherwise, it produces a daughter cell.
Figure 3
Tumour population dynamics for _t_=0–90 months with low progeny proliferation capacity (_ρ_=10), and disabled migration and spontaneous cell death (i.e., _α_=_μ_=0). The tumour size oscillates because of dying cells at the outer rim, which get replaced by cells from the tumour core that were previously quiescent. The initiating single cancer stem cell is not liberated sufficiently to divide symmetrically, resulting in a pseudo-steady-state tumour size at around 110 cells.
Figure 4
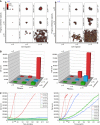
Tumour growth dynamics over time for representative parameters. For progeny proliferation capacities, _ρ_=(10,15,20), migration rates, _μ_=(0,5,15) and spontaneous cell death rates, _α_=(0%, 5%), per day, tumour growths are simulated. (A) Representative simulation results after _t_=38 months. Without cell death and migration (_α_=_μ_=0), no malignant tumour can form. With increasing migration rate, the tumours grow bigger, but for tumours with low progeny proliferation capacity (_ρ_max=10) symmetric stem cell divisions occur frequently, allowing for tumour growth expansion. Increasing the spontaneous death rate to _α_=5% liberates the stem cells to develop multiple clusters of tumour cells, if the migration rate is sufficiently high. S: number of cancer stem cells; n: number of cancer cells. (B) Average cell counts. Average cell counts are shown at _t_=38 months for different migration rates and proliferation capacities for 40 simulations each, without (_α_=0) and with (_α_=5) spontaneous cell death. (C) Average tumour growth curves for all parameters for _t_=240 months (i.e., 20 years). The vertical dotted lines show the tumour cell count at _t_=38 months.
Figure 5
(A) Spatiotemporal evolution of the self-metastatic tumour population at different time points. Shown is the proliferative capacity and the proliferative state distribution. Proliferation mainly occurs on the tumour boundary, and cells with high proliferative capacity are located in the quiescent core. (B) Cell proliferation analysis with BrdU staining in a HCT116 cell population growing in culture at 7 and 13 days and radial distribution of BrdU positive cell frequency (reproduced by kind permission of Springer, from Galle et al, 2009).
Figure 6
(A) All the common features of cell growth, including initial formation of gaps in tumour clones (left) and growth by self-seeding of clones (right), can readily be explained by basic cell kinetics. The arrows indicate locations of cancer stem cells in the simulation with parameters, _ρ_=10, _α_=5% and _p_s=1%. (B) Shown for comparison are tumourigenically transformed murine lung fibroblasts displaying migration-dependent clusterings arising from a single-plated cell per well.
Figure 7
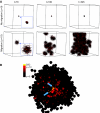
Three-dimensional simulations elucidating the pivotal role of migration in tumour growth and progression. (A) Without migration (_μ_=0, top row), no cells can be shed from the tumour to form foci of micrometastases and the tumour remains dormant. Cancer cell migration (_μ_=15, bottom row) is necessary to exhibit tumour growth and progression over time (_t_=70, 180, 525 days, left to right) through the formation of self-metastases. (B) High-resolution visualisation of a representative three-dimensional tumour cluster after the cancer stem cell (CSC) (yellow) has divided (arrows). Both stem cells are in the core of the tumour cluster with a radial proliferation capacity gradient.
Figure 8
Symmetric division rate and tumour morphology in simulations of tumour growth up to 100 000 cells. Symmetric division rates of _p_s=25% and _p_s=50% result in self-metastatic growth comparable with _p_s=1% (Figures 4, 5, 6 and 7). The stem cell pool in each tumour cluster increases with increasing _p_s and cancer stem cells are enriched in the tumour core. A tumour composed of only stem cells, that is, _p_s=100%, features a radially symmetric morphology. Parameters are _ρ_max=15, _μ_=15 and _α_=1.
Comment in
- Inflammatory breast carcinoma as a model of accelerated self-metastatic expansion by intravascular growth.
Vermeulen PB, Van Laere SJ, Dirix LY. Vermeulen PB, et al. Br J Cancer. 2009 Sep 15;101(6):1028-9; author reply 1030. doi: 10.1038/sj.bjc.6605251. Epub 2009 Aug 25. Br J Cancer. 2009. PMID: 19707200 Free PMC article. No abstract available.
Similar articles
- Paradoxical dependencies of tumor dormancy and progression on basic cell kinetics.
Enderling H, Anderson AR, Chaplain MA, Beheshti A, Hlatky L, Hahnfeldt P. Enderling H, et al. Cancer Res. 2009 Nov 15;69(22):8814-21. doi: 10.1158/0008-5472.CAN-09-2115. Epub 2009 Nov 3. Cancer Res. 2009. PMID: 19887613 - Loss of cell-surface receptor EphB2 is important for the growth, migration, and invasiveness of a colon cancer cell line.
Senior PV, Zhang BX, Chan ST. Senior PV, et al. Int J Colorectal Dis. 2010 Jun;25(6):687-94. doi: 10.1007/s00384-010-0916-7. Epub 2010 Mar 26. Int J Colorectal Dis. 2010. PMID: 20339854 - Discovery of Power-Law Growth in the Self-Renewal of Heterogeneous Glioma Stem Cell Populations.
Sugimori M, Hayakawa Y, Boman BM, Fields JZ, Awaji M, Kozano H, Tamura R, Yamamoto S, Ogata T, Yamada M, Endo S, Kurimoto M, Kuroda S. Sugimori M, et al. PLoS One. 2015 Aug 18;10(8):e0135760. doi: 10.1371/journal.pone.0135760. eCollection 2015. PLoS One. 2015. PMID: 26284929 Free PMC article. - Experimental chemotherapy and concepts related to the cell cycle.
Tannock IF. Tannock IF. Int J Radiat Biol Relat Stud Phys Chem Med. 1986 Feb;49(2):335-55. doi: 10.1080/09553008514552581. Int J Radiat Biol Relat Stud Phys Chem Med. 1986. PMID: 3510996 Review. - Tumour stem cell-targeted treatment: elimination or differentiation.
Massard C, Deutsch E, Soria JC. Massard C, et al. Ann Oncol. 2006 Nov;17(11):1620-4. doi: 10.1093/annonc/mdl074. Epub 2006 May 3. Ann Oncol. 2006. PMID: 16600978 Review.
Cited by
- Towards verifiable cancer digital twins: tissue level modeling protocol for precision medicine.
Kemkar S, Tao M, Ghosh A, Stamatakos G, Graf N, Poorey K, Balakrishnan U, Trask N, Radhakrishnan R. Kemkar S, et al. Front Physiol. 2024 Oct 23;15:1473125. doi: 10.3389/fphys.2024.1473125. eCollection 2024. Front Physiol. 2024. PMID: 39507514 Free PMC article. Review. - Detection, significance and potential utility of circulating tumor cells in clinical practice in breast cancer (Review).
Rusnáková DŠ, Aziri R, Dubovan P, Jurík M, Mego M, Pinďák D. Rusnáková DŠ, et al. Oncol Lett. 2024 Oct 17;29(1):10. doi: 10.3892/ol.2024.14756. eCollection 2025 Jan. Oncol Lett. 2024. PMID: 39492933 Free PMC article. Review. - Calibrating tumor growth and invasion parameters with spectral spatial analysis of cancer biopsy tissues.
Pasetto S, Montejo M, Zahid MU, Rosa M, Gatenby R, Schlicke P, Diaz R, Enderling H. Pasetto S, et al. NPJ Syst Biol Appl. 2024 Oct 2;10(1):112. doi: 10.1038/s41540-024-00439-0. NPJ Syst Biol Appl. 2024. PMID: 39358360 Free PMC article. - Spatially fractionated GRID radiation potentiates immune-mediated tumor control.
Bekker RA, Obertopp N, Redler G, Penagaricano J, Caudell JJ, Yamoah K, Pilon-Thomas S, Moros EG, Enderling H. Bekker RA, et al. Radiat Oncol. 2024 Sep 13;19(1):121. doi: 10.1186/s13014-024-02514-6. Radiat Oncol. 2024. PMID: 39272128 Free PMC article. - Physics-based tissue simulator to model multicellular systems: A study of liver regeneration and hepatocellular carcinoma recurrence.
Luque LM, Carlevaro CM, Llamoza Torres CJ, Lomba E. Luque LM, et al. PLoS Comput Biol. 2023 Mar 6;19(3):e1010920. doi: 10.1371/journal.pcbi.1010920. eCollection 2023 Mar. PLoS Comput Biol. 2023. PMID: 36877741 Free PMC article.
References
- Anderson ARA (2005) A hybrid mathematical model of solid tumour invasion: the importance of cell adhesion. Math Med Biol 22(2): 163–186 - PubMed
- Anderson ARA, Chaplain MAJ, Rejniak KA (2007) Single-Cell-Based Models in Biology and Medicine. Birkhauser: Basel
Publication types
MeSH terms
LinkOut - more resources
Full Text Sources


