Conserved introns reveal novel transcripts in Drosophila melanogaster - PubMed (original) (raw)
Conserved introns reveal novel transcripts in Drosophila melanogaster
Michael Hiller et al. Genome Res. 2009 Jul.
Abstract
Noncoding RNAs that are-like mRNAs-spliced, capped, and polyadenylated have important functions in cellular processes. The inventory of these mRNA-like noncoding RNAs (mlncRNAs), however, is incomplete even in well-studied organisms, and so far, no computational methods exist to predict such RNAs from genomic sequences only. The subclass of these transcripts that is evolutionarily conserved usually has conserved intron positions. We demonstrate here that a genome-wide comparative genomics approach searching for short conserved introns is capable of identifying conserved transcripts with a high specificity. Our approach requires neither an open reading frame nor substantial sequence or secondary structure conservation in the surrounding exons. Thus it identifies spliced transcripts in an unbiased way. After applying our approach to insect genomes, we predict 369 introns outside annotated coding transcripts, of which 131 are confirmed by expressed sequence tags (ESTs) and/or noncoding FlyBase transcripts. Of the remaining 238 novel introns, about half are associated with protein-coding genes-either extending coding or untranslated regions or likely belonging to unannotated coding genes. The remaining 129 introns belong to novel mlncRNAs that are largely unstructured. Using RT-PCR, we verified seven of 12 tested introns in novel mlncRNAs and 11 of 17 introns in novel coding genes. The expression level of all verified mlncRNA transcripts is low but varies during development, which suggests regulation. As conserved introns indicate both purifying selection on the exon-intron structure and conserved expression of the transcript in related species, the novel mlncRNAs are good candidates for functional transcripts.
Figures
Figure 1.
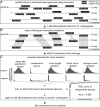
Overview of the computational intron prediction procedure. (A) Introns are predicted using intronscan on both strands of the D. melanogaster genome, yielding a total of ∼1.4 million predictions. Independent intronscan predictions in the other insect genomes were made. (B) Only those D. melanogaster intron predictions are retained that have an orthologous prediction in at least one additional genome. (C) A support vector machine (SVM) classifier based on five features is used to distinguish positive (real introns) and negative training samples (false predictions). These features measure characteristic splice site substitutions, sequence conservation in the middle part of introns, and variation of the intron length, donor, and acceptor score between species. As indicated by the distributions, these features are highly discriminative for positive and negative samples. By using this classifier, we predict 369 conserved introns.
Figure 2.
Nucleotide frequencies in splice site positions differ among insect genomes. The figure plots the nucleotide frequency difference (relative to D. melanogaster) of the 23,499 real introns for the donor positions +3…+6 and the acceptor positions −7…−3 for 14 insect species. While differences are often small, D. willistoni, T. castaneum, and A. mellifera have a strong preference for A over G at position +3 and for T over C at −3, which is still consistent with the splice site consensus (sequence logo made using
). These preferences correlate with the A+T content of these genomes (D. willistoni, 63%; T. castaneum, 67%; A. mellifera, 67%; compared with D. melanogaster, 58%) (Bergman et al. 2002; Honeybee Genome Sequencing Consortium 2006; Tribolium Genome Sequencing Consortium 2008). Donor position +2 is not shown due to tiny frequency differences between the two possible nucleotides (C and T).
Figure 3.
Evaluating characteristic intron evolution. (A) Two predicted introns with orthologous intronscan predictions in other species are shown. The prediction on top exhibits several substitutions in the splice site regions that are characteristic for real introns (e.g., C-to-T substitutions at acceptor position −3). Furthermore, this prediction has a low sequence conservation within the intron (average phastCons score for the region +8…+20 and −20…−8 is only 0.002). This prediction gets a high probability for being a real intron (0.999). In contrast, the prediction at the bottom has substitutions that are inconsistent with intron evolution (e.g., A-to-G substitution at acceptor position −3), and it exhibits conservation throughout the intron (average phastCons score is 0.92). The SVM probability for being a real intron is consequently low (0.001). Positive substitution scores are shown in shades of green; negatives in shades of red. Substitution scores are only considered for the donor (positions +2…+6) and acceptor splice site (positions −7…−3). Note that the substitution scores are specific for each pair D. melanogaster with another species; thus, the same substitution with respect to different species can get different scores. (B) The distribution of the summed substitution scores (left) and the average conservation scores (right) show a substantial difference between our positive and negative samples. The position of the values of the introns from panel A are indicated. For a better visualization, the _y_-axis for positive and negative samples has a different scale.
Figure 4.
Examples of transcript-confirmed intron predictions. (A) A predicted intron is located in the 5′ UTR of the protein-coding gene CG14614, whose current 5′ UTR annotation consists of only 2 nt. (B) Example of a predicted intron that belongs to a transcript overlapping an intron of dally in the antisense direction. (C) Example of a predicted intron that belongs to a potentially tissue-specific noncoding RNA, as 13 of the 14 supporting ESTs originate from a salivary gland library (ESG01). (D) A predicted intron that overlaps a noncoding FlyBase transcript (pncr009:3L) that has no intron annotation. pncr009:3L was found to be a structured precursor for small interfering RNAs (Okamura et al. 2008). (E) Example of a “cluster” of three introns within ∼400 nt. All three introns are predicted with a probability of >0.999 and belong to a potentially coding gene (BLASTX hits in several Drosophila species). Examples B_–_E illustrate that our approach finds introns that are located in regions of low sequence conservation, indicated by low phastCons conservation scores up- and downstream of the intron. Modified UCSC genome browser (Karolchik et al. 2008) screenshots were used to make this figure.
Figure 5.
Predicted introns in novel protein-coding genes. (A) A predicted intron is consistent with a two-exon coding gene predicted by CONTRAST (Gross et al. 2007). (B) Several predicted introns overlap a coding gene model predicted by NSCAN (Gross and Brent 2006). While the two downstream introns are in agreement with the NSCAN predictions, the two upstream introns are not. However, a BLASTX run of the entire region excluding the four introns (represents the spliced transcript) gives a perfect hit with a D. melanogaster protein (SwissProt Q6IL55) as well as hits in eight other Drosophila species. The positions of the four introns and the NSCAN predicted start codon in the Q6IL55 protein sequence are indicated as dashed lines.
Figure 6.
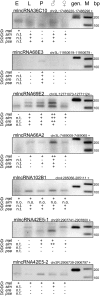
Experimentally verified introns in mlncRNA transcripts. The expression of the spliced transcript was tested in embryo (E), larva (L), pupa (P), male (♂), and female (♀) stages. Ethidium bromide–stained agarose gels show the RT-PCR results for D. melanogaster. Expression data of the orthologous transcripts in D. simulans (D.sim), D. erecta (D.ere), and D. pseudoobscura (D.pse) are shown below the D. melanogaster (D.mel) data. Genomic DNA (gen.) was used as a PCR control, and size was measured according to a 100-bp Ladder (M). PCR products were verified by sequencing. +/++, expressed; −, no band; n.o., no orthologous intron; n.t., not tested. Weaker and stronger expression in different stages are indicated by + and ++, respectively.
Similar articles
- Identification of putative noncoding polyadenylated transcripts in Drosophila melanogaster.
Tupy JL, Bailey AM, Dailey G, Evans-Holm M, Siebel CW, Misra S, Celniker SE, Rubin GM. Tupy JL, et al. Proc Natl Acad Sci U S A. 2005 Apr 12;102(15):5495-500. doi: 10.1073/pnas.0501422102. Epub 2005 Apr 4. Proc Natl Acad Sci U S A. 2005. PMID: 15809421 Free PMC article. - Protein-coding structured RNAs: A computational survey of conserved RNA secondary structures overlapping coding regions in drosophilids.
Findeiss S, Engelhardt J, Prohaska SJ, Stadler PF. Findeiss S, et al. Biochimie. 2011 Nov;93(11):2019-23. doi: 10.1016/j.biochi.2011.07.023. Epub 2011 Jul 31. Biochimie. 2011. PMID: 21835221 - Identification of unannotated exons of low abundance transcripts in Drosophila melanogaster and cloning of a new serine protease gene upregulated upon injury.
Maia RM, Valente V, Cunha MA, Sousa JF, Araujo DD, Silva WA Jr, Zago MA, Dias-Neto E, Souza SJ, Simpson AJ, Monesi N, Ramos RG, Espreafico EM, Paçó-Larson ML. Maia RM, et al. BMC Genomics. 2007 Jul 24;8:249. doi: 10.1186/1471-2164-8-249. BMC Genomics. 2007. PMID: 17650329 Free PMC article. - Exonization of transposed elements: A challenge and opportunity for evolution.
Schmitz J, Brosius J. Schmitz J, et al. Biochimie. 2011 Nov;93(11):1928-34. doi: 10.1016/j.biochi.2011.07.014. Epub 2011 Jul 26. Biochimie. 2011. PMID: 21787833 Review. - Incredible RNA: Dual Functions of Coding and Noncoding.
Nam JW, Choi SW, You BH. Nam JW, et al. Mol Cells. 2016 May 31;39(5):367-74. doi: 10.14348/molcells.2016.0039. Epub 2016 May 3. Mol Cells. 2016. PMID: 27137091 Free PMC article. Review.
Cited by
- Hidden treasures in unspliced EST data.
Engelhardt J, Stadler PF. Engelhardt J, et al. Theory Biosci. 2012 May;131(1):49-57. doi: 10.1007/s12064-012-0151-6. Epub 2012 Apr 8. Theory Biosci. 2012. PMID: 22485013 - Homology-based annotation of non-coding RNAs in the genomes of Schistosoma mansoni and Schistosoma japonicum.
Copeland CS, Marz M, Rose D, Hertel J, Brindley PJ, Santana CB, Kehr S, Attolini CS, Stadler PF. Copeland CS, et al. BMC Genomics. 2009 Oct 8;10:464. doi: 10.1186/1471-2164-10-464. BMC Genomics. 2009. PMID: 19814823 Free PMC article. - The roles of long noncoding RNAs in breast cancer metastasis.
Liu L, Zhang Y, Lu J. Liu L, et al. Cell Death Dis. 2020 Sep 14;11(9):749. doi: 10.1038/s41419-020-02954-4. Cell Death Dis. 2020. PMID: 32929060 Free PMC article. Review. - Unconstrained mining of transcript data reveals increased alternative splicing complexity in the human transcriptome.
Mollet IG, Ben-Dov C, Felício-Silva D, Grosso AR, Eleutério P, Alves R, Staller R, Silva TS, Carmo-Fonseca M. Mollet IG, et al. Nucleic Acids Res. 2010 Aug;38(14):4740-54. doi: 10.1093/nar/gkq197. Epub 2010 Apr 12. Nucleic Acids Res. 2010. PMID: 20385588 Free PMC article. - Evolution of the unspliced transcriptome.
Engelhardt J, Stadler PF. Engelhardt J, et al. BMC Evol Biol. 2015 Aug 20;15:166. doi: 10.1186/s12862-015-0437-7. BMC Evol Biol. 2015. PMID: 26289325 Free PMC article.
References
- Altschul SF, Gish W, Miller W, Myers EW, Lipman DJ. Basic local alignment search tool. J Mol Biol. 1990;215:403–410. - PubMed
- Amaral PP, Dinger ME, Mercer TR, Mattick JS. The eukaryotic genome as an RNA machine. Science. 2008;319:1787–1789. - PubMed
- Arya R, Mallik M, Lakhotia SC. Heat shock genes: Integrating cell survival and death. J Biosci. 2007;32:595–610. - PubMed
- Badger JH, Olsen GJ. Critica: Coding region identification tool invoking comparative analysis. Mol Biol Evol. 1999;16:512–524. - PubMed
Publication types
MeSH terms
Substances
LinkOut - more resources
Full Text Sources
Molecular Biology Databases
Research Materials


