Cortactin promotes migration and platelet-derived growth factor-induced actin reorganization by signaling to Rho-GTPases - PubMed (original) (raw)
. 2009 Jul;20(14):3209-23.
doi: 10.1091/mbc.e08-12-1180. Epub 2009 May 20.
Malgorzata Szczodrak, J Margit Oelkers, Markus Ladwein, Filippo Acconcia, Stefanie Benesch, Sonja Auinger, Jan Faix, J Victor Small, Simona Polo, Theresia E B Stradal, Klemens Rottner
Affiliations
- PMID: 19458196
- PMCID: PMC2710823
- DOI: 10.1091/mbc.e08-12-1180
Cortactin promotes migration and platelet-derived growth factor-induced actin reorganization by signaling to Rho-GTPases
Frank P L Lai et al. Mol Biol Cell. 2009 Jul.
Abstract
Dynamic actin rearrangements are initiated and maintained by actin filament nucleators, including the Arp2/3-complex. This protein assembly is activated in vitro by distinct nucleation-promoting factors such as Wiskott-Aldrich syndrome protein/Scar family proteins or cortactin, but the relative in vivo functions of each of them remain controversial. Here, we report the conditional genetic disruption of murine cortactin, implicated previously in dynamic actin reorganizations driving lamellipodium protrusion and endocytosis. Unexpectedly, cortactin-deficient cells showed little changes in overall cell morphology and growth. Ultrastructural analyses and live-cell imaging studies revealed unimpaired lamellipodial architecture, Rac-induced protrusion, and actin network turnover, although actin assembly rates in the lamellipodium were modestly increased. In contrast, platelet-derived growth factor-induced actin reorganization and Rac activation were impaired in cortactin null cells. In addition, cortactin deficiency caused reduction of Cdc42 activity and defects in random and directed cell migration. Reduced migration of cortactin null cells could be restored, at least in part, by active Rac and Cdc42 variants. Finally, cortactin removal did not affect the efficiency of receptor-mediated endocytosis. Together, we conclude that cortactin is fully dispensable for Arp2/3-complex activation during lamellipodia protrusion or clathrin pit endocytosis. Furthermore, we propose that cortactin promotes cell migration indirectly, through contributing to activation of selected Rho-GTPases.
Figures
Figure 1.
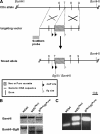
Sequential conditional targeting of both cortactin alleles in murine ES cells. (A) Targeting strategy for cortactin allele. Two targeting constructs carrying either a neomycin (harboring an internal BglII site) or a puromycin (harboring an internal BamHI site) resistance cassette are depicted to target the wild-type cortactin allele (Cttn) in two sequential targeting experiments in murine ES cells. (B) Genomic Southern on ES cells carrying two wild-type (wt/wt) cortactin alleles, one wild-type and one floxed (harboring the neomycin cassette) cortactin allele [wt/fl(Neo)], and two floxed [fl(Neo)/fl(Puro)] alleles (1 allele harboring a neomycin and the other allele a puromycin cassette). Genomic DNA extracted from each sample was digested with either BamHI alone, or BamHI together with BglII, and hybridized to the Southern probe (corresponding to genomic DNA sequence outside the targeting vector) as shown in A. Note that only the Puro floxed [fl(Puro)] allele produced a lower hybridization band with BamHI digest alone, whereas both Neo [fl(Neo)] and Puro [fl(Puro)] floxed alleles resulted in a lower hybridization band when double digested with BamHI and BglII. (C) PCR genotyping of ES cells carrying the wild-type, single-targeted or double-targeted alleles. The top and bottom bands indicate the presence of floxed alleles (Neo or Puro) and the wild-type allele, respectively.
Figure 2.
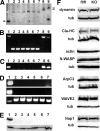
Cortactin disruption and expression of regulators of the actin cytoskeleton or endocytosis. (A) Genomic Southern hybridization of immortalized fibroblast clones before and after Cre-mediated deletion. Genomic DNA was digested with HindIII and hybridized to a radioactively labeled 1-kb cortactin probe. Black, white, and gray arrowheads indicate wild-type cortactin allele, Cre-deleted cortactin allele and Neo- or Puro-targeted alleles, respectively. Lane 1, wild-type cells; lanes 2–6, individual clones isolated upon Cre-recombinase–mediated cortactin gene deletion; lane 7, population pooled from clones 2–6; lane 8, double cortactin allele-targeted ES cell clone (genotype flox/flox); and lane 9, single cortactin allele-targeted ES cell clone (genotype flox/wt). (B) PCR genotyping using primers flanking the floxed cortactin exon 7. Top and bottom bands show the presence of floxed/wild-type and deleted alleles, respectively. Lanes are as described in A. (C) PCR genotyping using primers specific for cortactin exon 7. A PCR product indicates the presence of either wild-type or floxed allele. Lanes are as described in A. (D) RT-PCR detection of cortactin mRNA. Top, middle and bottom panels refer to PCR reactions with primers specific for cortactin N-terminal and C-terminal parts, and SPIN90 (loading control), respectively. Lanes 1–7 are as described in A. (E) Immunoblotting with cortactin antibody 4F-11 (top) compared with anti-α-tubulin antibody (bottom). Lanes 1–7 are as described in A. (F) Immunoblotting of control (fl/fl) and cortactin KO fibroblast cells with actin and endocytic regulators as indicated (Cla-HC, clathrin heavy chain). Anti-α-tubulin was used as loading control.
Figure 3.
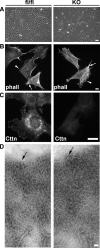
Cortactin is not essential for lamellipodium protrusion and stress fiber formation. (A) Morphology of control (fl/fl) and cortactin KO fibroblast cells grown on plastic cell culture dishes. Bar, 50 μm. (B) Phalloidin (phall) staining of fixed control and KO cells on fibronectin-coated glass coverslips. Arrows and arrowheads mark stress fibers and lamellipodia, respectively. Bar, 10 μm. (C) Immunolabeling with monoclonal anti-cortactin antibodies (clone 289) confirming loss of specific labeling in KO cells. (D) Electron microscopy of negatively stained whole-mount cytoskeletons of control and KO cells showing actin filament networks at the leading edge (cell edges indicated by black arrows). Bar, 50 nm.
Figure 4.
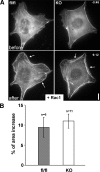
Rac1-induced protrusion in the presence and absence of cortactin. (A) Representative individual frames from epifluorescence time-lapse movies of EGFP-actin–expressing control and KO cells before and after microinjection with constitutively active Rac1 (injection at time 0). Time is in minutes and seconds. White arrows highlight lamellipodia induced by this treatment in both cell types. Bar, 10 μm. (B) Quantification of cell area increase observed within 7.5 min after Rac injection. Data represent means ± SEM.
Figure 5.
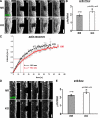
Actin network turnover in lamellipodia of control and cortactin KO cells. (A) Representative examples of control (fl/fl) and cortactin-deficient (KO) fibroblasts coexpressing myc-tagged L61-Rac1 and EGFP-actin, and subjected to FRAP experiments in the lamellipodium. Note actin recovery from the lamellipodium front, as expected (Wang, 1985; Lai et al., 2008), in both cell types. Time is in seconds; bar, 2 μm. (B) Quantification of the rate of rearward actin movement based on FRAP experiments as shown in A. All data are means ± SEM (error bars). Acceleration of actin flow in the absence of cortactin was confirmed to be statistically significant (*) by one-sided two-sample t test (p ≤ 0.023). (C) Lamellipodial actin recovery as assessed by FRAP for a lamellipodial width of 1.6 μm in control and cortactin null cells as indicated. Data are means and SEM measured for each time point and cell type as indicated (n = 4). Linear curves correspond to best fits of means (black and red lines for cortactin KO and control cells, respectively). Fitted data followed equation: y = a(1 − exp(−bx)), with a = 1.0408 and b = 0.033 in fl/fl, and a = 1.1013 and b = 0.044 in KO cells. _t_1/2 values were calculated by solving the corresponding equations with a fluorescence intensity of 50% of the maximum recovery value derived from each fitted curve. (D) Representative examples of control (fl/fl) and cortactin-deficient (KO) fibroblasts coexpressing myc-tagged L61-Rac1 and the Arp2/3-complex subunit p16B, and subjected to FRAP experiments in the lamellipodium. p16B fluorescence recovers from the lamellipodium front as described in both cell types. (E) Quantification of rearward movement of p16B as shown for actin above. All data are means ± SEM (error bars). Increased flow in cortactin null cells was statistically significant, as confirmed by one-sided two-sample t test (p ≤ 0.046).
Figure 6.
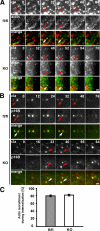
Actin recruitment to ccps in the absence of cortactin. (A) Representative TIRF images of control (fl/fl) and KO cells cotransfected with EGFP-actin (actin) and mCherry-clathrin (cla) showing cointernalization of actin and clathrin. Red and white arrows mark cointernalizing pits. Bar, 1 μm. (B) Cointernalization of Arp2/ 3-complex and clathrin in both control and cortactin KO cells as visualized by cotransfection with EGFP-ArpC5B (p16B) and mCherry-clathrin (cla). Arrows and bar are as described in A. (C) Quantification of actin recruitment to internalizing ccps. All data are means ± SEM. At least 240 individual pits and 16 cells were analyzed for each cell type.
Figure 7.
Cortactin is not required for clathrin-mediated endocytosis. (A) Kinetics of EGF internalization in control (fl/fl) and cortactin KO cells treated at the indicated time points with 1 ng/ml 125I-EGF. Data are means ± SEM (error bars) of two independent experiments both performed in triplicate. The internalization constants (_K_e) are indicated in the panel. (B) EGFR numbers/cell measured as described in Materials and Methods. Data are means ± SEM (error bars) of two independent experiments both performed in triplicate. (C) Western blot analysis of EGFR degradation as well as Akt and ERK activation (pAkt and pERK) in control and cortactin knockout cells treated at the indicated time points with 100 ng/ml EGF. Total Akt, ERK, vinculin, and cortactin were included in the panel as blot normalization. Blots are representative of three independent experiments. (D) Densitometric analysis of EGFR degradation performed as described in Materials and Methods. Data are means ± SEM (error bars) of two independent experiments.
Figure 8.
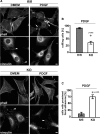
Cortactin deficiency abrogates PDGF-induced actin reorganization. (A) Effect of PDGF treatment on cell morphology; cells were stained for the actin cytoskeleton (phall) and for focal adhesions with anti-vinculin antibodies. Arrows and arrowheads mark membrane ruffles and focal adhesions, respectively. Bars, 10 μm. Note induction of ruffles and concomitant reduction of focal adhesions in control, but not in cortactin KO cells. (B) Quantification of PDGF-treated control (fl/fl) and KO cells capable of forming membrane ruffles. All data are means ± SEM (error bars). Two-sample two-sided t test, p ≤ 0.003, ∼300 cells from three independent experiments categorized for each cell type. (C) Quantification of PDGF-induced focal adhesion disassembly. All data are means ± SEM (error bars). Two-sided two-sample t test, p ≤ 0.025, >360 cells from three independent experiments categorized for each cell type.
Figure 9.
PDGF-induced Rac activation and constitutive activities of selected Rho GTPases. (A) Determination of active Rac levels (Rac-GTP) in starved control and cortactin knockout cells treated with DMEM alone or DMEM containing 10 ng/ml PDGF (10 min) using G-LISA assay. Data are means ± SEM (error bars) and were statistically compared using two-sample two-sided t test. (B–D) Constitutive activities of selected Rho-GTPases in control (fl/fl) and cortactin KO cells as indicated (G-LISA), all data are means ± SEM (error bars). Reduction of Cdc42 activity in cortactin-deficient cells was confirmed statistically significant using two-sided two-sample t test (p ≤ 0.029).
Figure 10.
Cortactin deficiency reduces cell migration. (A) Box and whiskers plots showing migration rates of control (fl/fl) and cortactin KO cells in subconfluent cultures. The line within the box indicates median, the box boundaries contain 50% (25–75%) and the whiskers 80% (10–90%) of all measurements, whereas outlying points are shown as dots. The reduction of migration of KO cells was statistically significant at p ≤ 0.0001; two-sided two-sample t test. (B) Directionality of control (fl/fl) and KO cells as indicated. Data are displayed as in A. Directionality was calculated by dividing net migration distance by total distance. (C) Chemotaxis plots of control (fl/fl) and KO cells in random migration assay. The position of each cell at time zero was centered at the origin of the grid and the tracks correspond to the movement of individual cells over time. Individual tracks slower or faster than the arithmetic mean of all tracks were displayed in red or black, respectively. The total duration of the movies was 495 min.
Figure 11.
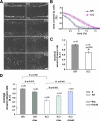
Loss of cortactin function reduces wound healing efficiency. (A) Selected frames from wound healing movies for control (fl/fl) and cortactin KO cells. Time is in minutes; bar, 100 μm. (B) Average wound healing recovery curve for each cell population over time. KO cells take longer to cover the wounded area (i.e., reach 100%). (C) Maximal wound closure rates derived from the individual wound closure curves shown in B (see Materials and Methods). Data are means ± SEM (error bars), and the differences between cell types were confirmed to be statistically different by two-sided two-sample t test (p ≤ 0.001). (D) Average wound closure rates of control (fl/fl) or cortactin knockout (KO) cells expressing EGFP alone (as control) or EGFP-tagged, constitutively active Rac1 or Cdc42 as indicated. Column colors corresponding to experimental conditions are also given on the right in panel D. All data are means ± SEM (error bars). Differences between cell types or conditions were confirmed to be statistically significant by two-sided two-sample t test. n values correspond to number of movies recorded in at least three independent experiments.
Similar articles
- Role of actin polymerization and adhesion to extracellular matrix in Rac- and Rho-induced cytoskeletal reorganization.
Machesky LM, Hall A. Machesky LM, et al. J Cell Biol. 1997 Aug 25;138(4):913-26. doi: 10.1083/jcb.138.4.913. J Cell Biol. 1997. PMID: 9265656 Free PMC article. - Arp2/3 complex interactions and actin network turnover in lamellipodia.
Lai FP, Szczodrak M, Block J, Faix J, Breitsprecher D, Mannherz HG, Stradal TE, Dunn GA, Small JV, Rottner K. Lai FP, et al. EMBO J. 2008 Apr 9;27(7):982-92. doi: 10.1038/emboj.2008.34. Epub 2008 Feb 28. EMBO J. 2008. PMID: 18309290 Free PMC article. - Osmotic stress-induced remodeling of the cortical cytoskeleton.
Di Ciano C, Nie Z, Szászi K, Lewis A, Uruno T, Zhan X, Rotstein OD, Mak A, Kapus A. Di Ciano C, et al. Am J Physiol Cell Physiol. 2002 Sep;283(3):C850-65. doi: 10.1152/ajpcell.00018.2002. Am J Physiol Cell Physiol. 2002. PMID: 12176742 - Requirements for and consequences of Rac-dependent protrusion.
Steffen A, Koestler SA, Rottner K. Steffen A, et al. Eur J Cell Biol. 2014 May-Jun;93(5-6):184-93. doi: 10.1016/j.ejcb.2014.01.008. Epub 2014 Feb 11. Eur J Cell Biol. 2014. PMID: 24629839 Review. - Actin dynamics in cell migration.
Schaks M, Giannone G, Rottner K. Schaks M, et al. Essays Biochem. 2019 Oct 31;63(5):483-495. doi: 10.1042/EBC20190015. Essays Biochem. 2019. PMID: 31551324 Free PMC article. Review.
Cited by
- Cortactin is in a complex with VE-cadherin and is required for endothelial adherens junction stability through Rap1/Rac1 activation.
Moztarzadeh S, Sepic S, Hamad I, Waschke J, Radeva MY, García-Ponce A. Moztarzadeh S, et al. Sci Rep. 2024 Jan 12;14(1):1218. doi: 10.1038/s41598-024-51269-3. Sci Rep. 2024. PMID: 38216638 Free PMC article. - Mechanism of synergistic activation of Arp2/3 complex by cortactin and WASP-family proteins.
Fregoso FE, Boczkowska M, Rebowski G, Carman PJ, van Eeuwen T, Dominguez R. Fregoso FE, et al. Nat Commun. 2023 Oct 28;14(1):6894. doi: 10.1038/s41467-023-42229-y. Nat Commun. 2023. PMID: 37898612 Free PMC article. - The non-canonical roles of clathrin and actin in pathogen internalization, egress and spread.
Humphries AC, Way M. Humphries AC, et al. Nat Rev Microbiol. 2013 Aug;11(8):551-60. doi: 10.1038/nrmicro3072. Nat Rev Microbiol. 2013. PMID: 24020073 Review. - Cortactin as a target for FAK in the regulation of focal adhesion dynamics.
Tomar A, Lawson C, Ghassemian M, Schlaepfer DD. Tomar A, et al. PLoS One. 2012;7(8):e44041. doi: 10.1371/journal.pone.0044041. Epub 2012 Aug 29. PLoS One. 2012. PMID: 22952866 Free PMC article. - Short-hairpin RNA-mediated suppression of cortactin may inhibit the migration and invasion abilities of endometrial cancer cells by reducing lamellipodia.
Lin H, Fan Y, Zhi Z, Pang L, Sun D. Lin H, et al. Iran J Basic Med Sci. 2023;26(12):1390-1399. doi: 10.22038/IJBMS.2023.67633.14863. Iran J Basic Med Sci. 2023. PMID: 37970440 Free PMC article.
References
- Anton I. M., Jones G. E., Wandosell F., Geha R., Ramesh N. WASP-interacting protein (WIP): working in polymerisation and much more. Trends Cell Biol. 2007;17:555–562. - PubMed
- Aspenstrom P. The verprolin family of proteins: regulators of cell morphogenesis and endocytosis. FEBS Lett. 2005;579:5253–5259. - PubMed
- Auinger S., Small J. V. Correlated light and electron microscopy of the actin cytoskeleton. Methods Cell Biol. 2008;88:257–272. - PubMed
Publication types
MeSH terms
Substances
LinkOut - more resources
Full Text Sources
Molecular Biology Databases
Miscellaneous
