Transcriptional dysregulation in NIPBL and cohesin mutant human cells - PubMed (original) (raw)
. 2009 May 5;7(5):e1000119.
doi: 10.1371/journal.pbio.1000119. Epub 2009 May 26.
Zhe Zhang, Masashige Bando, Takehiko Itoh, Matthew A Deardorff, Dinah Clark, Maninder Kaur, Stephany Tandy, Tatsuro Kondoh, Eric Rappaport, Nancy B Spinner, Hugo Vega, Laird G Jackson, Katsuhiko Shirahige, Ian D Krantz
Affiliations
- PMID: 19468298
- PMCID: PMC2680332
- DOI: 10.1371/journal.pbio.1000119
Transcriptional dysregulation in NIPBL and cohesin mutant human cells
Jinglan Liu et al. PLoS Biol. 2009.
Abstract
Cohesin regulates sister chromatid cohesion during the mitotic cell cycle with Nipped-B-Like (NIPBL) facilitating its loading and unloading. In addition to this canonical role, cohesin has also been demonstrated to play a critical role in regulation of gene expression in nondividing cells. Heterozygous mutations in the cohesin regulator NIPBL or cohesin structural components SMC1A and SMC3 result in the multisystem developmental disorder Cornelia de Lange Syndrome (CdLS). Genome-wide assessment of transcription in 16 mutant cell lines from severely affected CdLS probands has identified a unique profile of dysregulated gene expression that was validated in an additional 101 samples and correlates with phenotypic severity. This profile could serve as a diagnostic and classification tool. Cohesin binding analysis demonstrates a preference for intergenic regions suggesting a cis-regulatory function mimicking that of a boundary/insulator interacting protein. However, the binding sites are enriched within the promoter regions of the dysregulated genes and are significantly decreased in CdLS proband, indicating an alternative role of cohesin as a transcription factor.
Conflict of interest statement
The authors have declared that no competing interests exist.
Figures
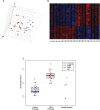
Figure 1. Classifications of the 33 training samples by gene expression.
(A) Unsupervised clustering of 17 healthy controls (blue dots) and 16 severe CdLS probands (red dots) by principle component analysis (PCA) of the 27,995 probe sets actively transcribed in LCLs. The separation between the training groups indicates that controls and probands have different gene expression patterns. (B) Heatmap showing that the identified 420 probe sets (FDR<0.01) are expressed dramatically differently between CdLS probands (PT) and healthy controls (N). Red represents genes that are upregulated and blue represents genes that are downregulated. The left 17 columns represent control samples, and the right 16 columns represent proband samples. Rows display gene expression levels. (C) Nearest centroid classifications of the 33 training samples and six testing samples. Among the training samples, two healthy controls and one CdLS proband were misclassified after Leave-One-Out cross validation. Among the testing samples, CdLS probands and two RBS probands were classified into CdLS group whereas the one healthy control and two probands with AGS were classified into the control group.
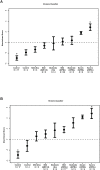
Figure 2. Classifier genes are identified for CdLS. Clear progression of discriminant score (DS) from low to high is correlated with the phenotype from unaffected → mild → moderate → severely affected with CdLS.
(A) The 23-gene classifier separates CdLS probands with NIPBL mutations from the rest of the individuals. Healthy controls, probands with other genetic disorders, CdLS probands with SMC1A mutations, and CdLS probands with no gene mutation identified are distinctly separated from each other in a progressive manner correlated with phenotypic severity. (B) The ten-gene classifier differentially categorizes all CdLS probands from non-CdLS individuals and plots correlate to the severity of the CdLS probands. Healthy controls are labeled as “Control,” disease severity is described as “Mild,” “Moderate,” and “Severe” CdLS probands with NIPBL mutations, SMC1A mutations or no identified gene mutation are labeled as “NIPBL,” “SMC1A,” or “No,” respectively. *, training samples; **, number of mild cases with an NIPBL mutation was reduced from 26 in (A) to 11 in (B) with the other 15 cases having been used as training samples.
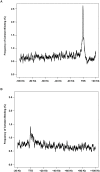
Figure 3. Cohesin binding analyzed in 15,162 unique transcripts demonstrates preferential binding to TSSs and TTSs.
(A) The frequency of cohesin binding has a sharp peak around TSS and falls to the background level upstream of this peak. (B) The frequency of cohesin binding has another peak around TTS. The height of this peak is about half that of the peak height seen at TSS. Similarly the regions downstream of this peak have a cohesin binding frequency close to the background level.
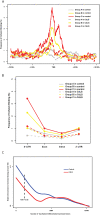
Figure 4. Frequency of cohesin binding around the TSS as related to transcriptional status in LCLs.
Group A (silver), nontranscribed silent genes in LCLs (4,784 unique Refseq mRNAs); group B (yellow), genes without expression alterations between controls and CdLS probands (9,199 unique RefSeq mRNAs); group C (red), genes differentially expressed in CdLS (FDR < 0.05) (1,179 unique RefSeq mRNAs). (A) Frequency of cohesin binding at the TSS of group C genes is much lower in CdLS than in control. Group B genes have a moderate reduction, and group A genes have little change. Overall cohesin binding around the TSS is greatest for those genes that are actively transcribed in LCLs and especially in those genes that are misexpressed in CdLS. (B) Within the intragenic regions, 5′-UTRs of the actively transcribed genes (groups B and C) have higher cohesin binding frequency in control than other intragenic regions whereas group A genes have frequency close to the background level in all regions. In CdLS, the frequency dropped in all three gene groups in CdLS and the difference between different gene groups and regions tends to diminish. (C) Cohesin binding within 2 kb around TSS is enriched in differentially expressed genes. The 10,378 unique genes expressed in LCLs are ranked by their F scores. The reference enrichment is the percentage of genes having cohesin binding within 2 kb (+/− 1 kb) around TSS. The relative enrichment is calculated as the value of cohesin binding enrichment in top-ranked genes over the reference enrichment. The relative enrichment point is calculated for the total number of genes prior to the point on the _x_-axis. The numbers on _x_-axis denote the statistical ranks. The curves are smoothed by the LOWESS algorithm.
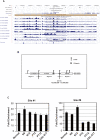
Figure 5. Cohesin and CTCF colocalize and separate the active chromatin region from the repressive chromatin region.
The cohesin site at this position is lost in CdLS, thus the silencing epigenetic signal from region 3 is able to migrate into region 2, which harbors ATP11A and downregulates its transcription. (A) Screen shot of ENCODE ENr132 region from the UCSC genome browser is displaying histone methylation and acetylation status, CTCF binding sites, and DNaseI sensitivity sites on this region in GM06990 cells (from Sanger Institute and University of Washington databases, respectively). hSCC1-Control and hSCC1-CdLS are custom tracks. hSCC1-Control track indicates the results of whole genome cohesin binding analysis in LCLs from controls, whereas hSCC1-CdLS track indicates the results of whole genome cohesin binding analysis in LCLs from the CdLS proband; data on CTCF_Bcell2_8 track are adapted from Wendt et al. . (B) Schematic of ENr132 locus as in (A). Five genes located in three regions are displayed. Two cohesin and six CTCF binding sites are shown. Cohesin and CTCF colocalize at Chromosome 13: 112,645,000–112,645,600, which separates region 2 from region 3. Cohesin binding at this position was lost in CdLS proband. (C) ChIP-qPCR validation in three different healthy controls “Normal,” “N6,” and “N12” and three additional CdLS probands “PT2,” “PT12,” and “CDL-017.” Cohesin bound to this locus was dramatically reduced among CdLS probands including a proband with an SMC1A mutation (CDL-017). Sites 1 and 2 are positive controls, site 8 spans Chromosome 13: 112,645,000–112,645,600.
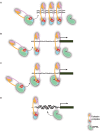
Figure 6. Proposed working models for cohesin and NIPBL.
(A) Cohesin's canonical role in regulating sister chromatid cohesion with NIPBL acting to facilitate the loading and unloading of the cohesin complex onto the chromosomes. It is not known if NIPBL directly interacts with chromatin. This model was described by Haering et al. . (B) Cohesin loading model: NIPBL loads cohesin onto chromatin at the promoters or _cis_-regulatory elements after which cohesin regulates transcription without the direct involvement of NIPBL. (C) Cohesin and NIPBL collaborative model: Cohesin and NIPBL form a protein complex that binds to promoters or _cis_-regulatory elements. The functional integrity of this complex is required for transcriptional regulation of target genes. (D) NIPBL chromatin remodeling model: NIPBL may affect the accessibility for cohesin, e.g., by changing chromatin structures, to bind to chromatin elements through yet unknown pathways. Transcriptional regulation through cohesin is secondarily affected.
Similar articles
- The effect of Nipped-B-like (Nipbl) haploinsufficiency on genome-wide cohesin binding and target gene expression: modeling Cornelia de Lange syndrome.
Newkirk DA, Chen YY, Chien R, Zeng W, Biesinger J, Flowers E, Kawauchi S, Santos R, Calof AL, Lander AD, Xie X, Yokomori K. Newkirk DA, et al. Clin Epigenetics. 2017 Aug 25;9:89. doi: 10.1186/s13148-017-0391-x. eCollection 2017. Clin Epigenetics. 2017. PMID: 28855971 Free PMC article. - Regional chromatin decompaction in Cornelia de Lange syndrome associated with NIPBL disruption can be uncoupled from cohesin and CTCF.
Nolen LD, Boyle S, Ansari M, Pritchard E, Bickmore WA. Nolen LD, et al. Hum Mol Genet. 2013 Oct 15;22(20):4180-93. doi: 10.1093/hmg/ddt265. Epub 2013 Jun 10. Hum Mol Genet. 2013. PMID: 23760082 Free PMC article. - Mutant cohesin affects RNA polymerase II regulation in Cornelia de Lange syndrome.
Mannini L, C Lamaze F, Cucco F, Amato C, Quarantotti V, Rizzo IM, Krantz ID, Bilodeau S, Musio A. Mannini L, et al. Sci Rep. 2015 Nov 19;5:16803. doi: 10.1038/srep16803. Sci Rep. 2015. PMID: 26581180 Free PMC article. - Cornelia de Lange syndrome: from molecular diagnosis to therapeutic approach.
Sarogni P, Pallotta MM, Musio A. Sarogni P, et al. J Med Genet. 2020 May;57(5):289-295. doi: 10.1136/jmedgenet-2019-106277. Epub 2019 Nov 8. J Med Genet. 2020. PMID: 31704779 Free PMC article. Review. - Cornelia de Lange syndrome.
Liu J, Baynam G. Liu J, et al. Adv Exp Med Biol. 2010;685:111-23. Adv Exp Med Biol. 2010. PMID: 20687500 Review.
Cited by
- Immunologic features of Cornelia de Lange syndrome.
Jyonouchi S, Orange J, Sullivan KE, Krantz I, Deardorff M. Jyonouchi S, et al. Pediatrics. 2013 Aug;132(2):e484-9. doi: 10.1542/peds.2012-3815. Epub 2013 Jul 1. Pediatrics. 2013. PMID: 23821697 Free PMC article. - The SMC Loader Scc2 Promotes ncRNA Biogenesis and Translational Fidelity.
Zakari M, Trimble Ross R, Peak A, Blanchette M, Seidel C, Gerton JL. Zakari M, et al. PLoS Genet. 2015 Jul 15;11(7):e1005308. doi: 10.1371/journal.pgen.1005308. eCollection 2015 Jul. PLoS Genet. 2015. PMID: 26176819 Free PMC article. - Dosage-sensitive regulation of cohesin chromosome binding and dynamics by Nipped-B, Pds5, and Wapl.
Gause M, Misulovin Z, Bilyeu A, Dorsett D. Gause M, et al. Mol Cell Biol. 2010 Oct;30(20):4940-51. doi: 10.1128/MCB.00642-10. Epub 2010 Aug 9. Mol Cell Biol. 2010. PMID: 20696838 Free PMC article. - A zebrafish model of Roberts syndrome reveals that Esco2 depletion interferes with development by disrupting the cell cycle.
Mönnich M, Kuriger Z, Print CG, Horsfield JA. Mönnich M, et al. PLoS One. 2011;6(5):e20051. doi: 10.1371/journal.pone.0020051. Epub 2011 May 26. PLoS One. 2011. PMID: 21637801 Free PMC article. - Isolated NIBPL missense mutations that cause Cornelia de Lange syndrome alter MAU2 interaction.
Braunholz D, Hullings M, Gil-Rodríguez MC, Fincher CT, Mallozzi MB, Loy E, Albrecht M, Kaur M, Limon J, Rampuria A, Clark D, Kline A, Dalski A, Eckhold J, Tzschach A, Hennekam R, Gillessen-Kaesbach G, Wierzba J, Krantz ID, Deardorff MA, Kaiser FJ. Braunholz D, et al. Eur J Hum Genet. 2012 Mar;20(3):271-6. doi: 10.1038/ejhg.2011.175. Epub 2011 Sep 21. Eur J Hum Genet. 2012. PMID: 21934712 Free PMC article.
References
- Hirano T. At the heart of the chromosome: SMC proteins in action. Nat Rev Mol Cell Biol. 2006;7:311–322. - PubMed
- Moldovan GL, Pfander B, Jentsch S. PCNA controls establishment of sister chromatid cohesion during S phase. Mol Cell. 2006;23:723–732. - PubMed
- Haering CH, Schoffnegger D, Nishino T, Helmhart W, Nasmyth K, et al. Structure and stability of cohesin's Smc1-kleisin interaction. Mol Cell. 2004;15:951–964. - PubMed
- Unal E, Arbel-Eden A, Sattler U, Shroff R, Lichten M, et al. DNA damage response pathway uses histone modification to assemble a double-strand break-specific cohesin domain. Mol Cell. 2004;16:991–1002. - PubMed
Publication types
MeSH terms
Substances
LinkOut - more resources
Full Text Sources
Molecular Biology Databases
Research Materials
Miscellaneous
