Two distinct types of inhibition mediated by cartwheel cells in the dorsal cochlear nucleus - PubMed (original) (raw)
Two distinct types of inhibition mediated by cartwheel cells in the dorsal cochlear nucleus
Jaime G Mancilla et al. J Neurophysiol. 2009 Aug.
Abstract
Individual neurons have been shown to exhibit target cell-specific synaptic function in several brain areas. The time course of the postsynaptic conductances (PSCs) strongly influences the dynamics of local neural networks. Cartwheel cells (CWCs) are the most numerous inhibitory interneurons in the dorsal cochlear nucleus (DCN). They are excited by parallel fiber synapses, which carry polysensory information, and in turn inhibit other CWCs and the main projection neurons of the DCN, pyramidal cells (PCs). CWCs have been implicated in "context-dependent" inhibition, producing either depolarizing (other CWCs) or hyperpolarizing (PCs) post synaptic potentials. In the present study, we used paired whole cell recordings to examine target-dependent inhibition from CWCs in neonatal rat DCN slices. We found that CWC inhibitory postsynaptic potentials (IPSPs) onto PCs are large (1.3 mV) and brief (half-width = 11.8 ms), whereas CWC IPSPs onto other CWCs are small (0.2 mV) and slow (half-width = 36.8 ms). Evoked IPSPs between CWCs exhibit paired-pulse facilitation, while CWC IPSPs onto PCs exhibit paired-pulse depression. Perforated-patch recordings showed that spontaneous IPSPs in CWCs are hyperpolarizing at rest with a mean estimated reversal potential of -67 mV. Spontaneous IPSCs were smaller and lasted longer in CWCs than in PCs, suggesting that the kinetics of the receptors are different in the two cell types. These results reveal that CWCs play a dual role in the DCN. The CWC-CWC network interactions are slow and sensitive to the average rate of CWC firing, whereas the CWC-PC network is fast and sensitive to transient changes in CWC firing.
Figures
FIG. 1.
Whole cell current-clamp recordings of a cartwheel cell (CWC, left) and a pyramid cell (PC, right), in the dorsal cochlear nucleus, showing their typical membrane voltage responses to current steps. The CWC from which the traces were obtained is the small cell at the top of the IR-DIC image shown in the center. The PC is the larger cell in the bottom with the pipette coming from the right. The resting membrane potential for the CWC was −68 mV, whereas that for the PC was −69 mV.
FIG. 2.
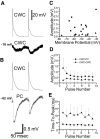
Trains of action potentials in CWCs produced inhibitory postsynaptic potentials (IPSPs) in nearby CWCs and PCs. A: mean IPSPs and the corresponding presynaptic action potentials for a CWC-CWC pair. The membrane potential at which the IPSPs were collected is noted. B: mean IPSPs and the corresponding presynaptic action potentials for a CWC-PC pair. C: amplitude of IPSPs in CWC-PC (•) and CWC-CWC (▴) pairs as a function of the membrane potentials at which the IPSPs were collected. D: mean ± SD amplitudes of IPSPs for 10 CWC-PC and 6 CWC-CWC pairs showing depression of IPSPs in the CWC-PC pairs and facilitation in the CWC-CWC pairs. E: mean time to peak ± SD of IPSPs for 10 CWC-PC and 6 CWC-CWC pairs showing small variability in time to peak for CWC-PC pairs and large variability for CWC-CWC pairs.
FIG. 3.
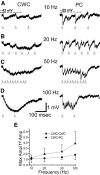
Trains of IPSPs in CWCs and PCs evoked by action potentials in presynaptic CWCs. A: 10-Hz train of IPSPs in a CWC-CWC pair (left) and in a CWC-PC pair (right). B: 20-Hz trains of IPSPs. C: 50-Hz trains of IPSPs, showing a greater degree of summation in the CWC than in the PC. D: 100-Hz train of IPSPs, showing that individual IPSPs summate to produce a large hyperpolarization in the CWC and a smaller hyperpolarization in the PC. E: population means for CWC-PC (•) and CWC-CWC (▴) pairs showing a higher degree of summation in CWC-CWC pairs. The maximum summation during the trains divided by the amplitude of the 1st pulse is plotted as a function of frequency. - - -, the membrane potential at which the IPSPs in A–D were collected. ↑, the timing of presynaptic action potentials. ↑ in D indicate the 1st and last presynaptic action potential.
FIG. 4.
Comparison of IPSPs produced by single action potentials (black traces) in CWCs with those produced by a burst of action potentials (red traces). Arrows indicate the timing of the action potentials in the burst. A: CWC-PC pair showing the mean of single action potentials and the mean IPSP from the single action potentials in black, whereas the mean burst and mean IPSP resulting from the burst are shown in red. B: CWC-CWC pair showing the mean single action potential and mean IPSP resulting from the action potential in black, whereas the mean burst and mean IPSP resulting from the burst are shown in red.
FIG. 5.
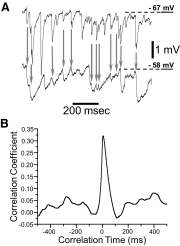
Traces of ongoing activity were collected in a CWC-PC pair to perform a cross-correlation analysis on the membrane potentials. A: simultaneously recorded traces for each of the cells in the pair. ↓, the IPSPs that occurred within 1 ms of each other in the 2 cells. - - -, the RMP of the cells. B: the mean correlogram of the membrane potential for 16 5-s traces in this pair had a maximum correlation coefficient of 0.32, which occurred with a delay of 7 ms.
FIG. 6.
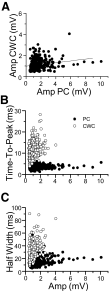
Measurements of simultaneously occurring IPSPs for 5 CWC-PC pairs with peaks near 0 in the correlograms. A: amplitudes of simultaneously occurring IPSPs are uncorrelated. —, the best fit to the data. B: times to peak of IPSPs in the CWCs (○) are longer than those in the PCs (•) and increase with increases in the amplitude of IPSPs. Time to peak of IPSPs in the PCs remain relatively constant regardless of the amplitude of the IPSPs. C: half-widths of IPSPs in the CWCs (○) showed a similar trend as the time to peak; they were longer than those of IPSPs in the PCs (•) and increased with increases in amplitude. Like the time to peak of IPSPs in the PCs, the half-widths of IPSPs in the PCs remained relatively constant regardless of the amplitude.
FIG. 7.
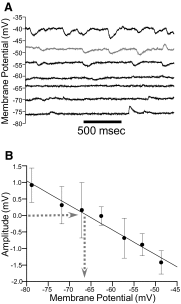
Reversal potential analysis for IPSPs recorded with perforated-patch recordings. A: voltage traces obtained with current steps of different amplitudes. IPSPs are seen at the resting membrane potential (gray trace) and at more hyperpolarized and depolarized membrane potentials. B: mean amplitudes for IPSPs collected in 3 cells at several different membrane potentials. Dashed lines indicate the reversal potential of the IPSPs.
FIG. 8.
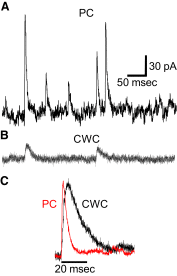
Current traces showing IPSCs obtained at a holding potential of −62 mV. A: IPSCs obtained from a PC are large and fast. B: IPSCs obtained from a CWC are smaller and slower than those in the PC. C: normalized mean IPSC for the same PC (red trace) shown in A and for the same CWC (black trace) shown in B.
Similar articles
- Sustained firing of cartwheel cells in the dorsal cochlear nucleus evokes endocannabinoid release and retrograde suppression of parallel fiber synapses.
Sedlacek M, Tipton PW, Brenowitz SD. Sedlacek M, et al. J Neurosci. 2011 Nov 2;31(44):15807-17. doi: 10.1523/JNEUROSCI.4088-11.2011. J Neurosci. 2011. PMID: 22049424 Free PMC article. - Spontaneous Activity Defines Effective Convergence Ratios in an Inhibitory Circuit.
Lu HW, Trussell LO. Lu HW, et al. J Neurosci. 2016 Mar 16;36(11):3268-80. doi: 10.1523/JNEUROSCI.3499-15.2016. J Neurosci. 2016. PMID: 26985036 Free PMC article. - Single axon IPSPs elicited in pyramidal cells by three classes of interneurones in slices of rat neocortex.
Thomson AM, West DC, Hahn J, Deuchars J. Thomson AM, et al. J Physiol. 1996 Oct 1;496 ( Pt 1)(Pt 1):81-102. doi: 10.1113/jphysiol.1996.sp021667. J Physiol. 1996. PMID: 8910198 Free PMC article. - Synaptic inputs to stellate cells in the ventral cochlear nucleus.
Ferragamo MJ, Golding NL, Oertel D. Ferragamo MJ, et al. J Neurophysiol. 1998 Jan;79(1):51-63. doi: 10.1152/jn.1998.79.1.51. J Neurophysiol. 1998. PMID: 9425176 - Dendritic Ca2+ transients evoked by action potentials in rat dorsal cochlear nucleus pyramidal and cartwheel neurons.
Molitor SC, Manis PB. Molitor SC, et al. J Neurophysiol. 2003 Apr;89(4):2225-37. doi: 10.1152/jn.00709.2002. Epub 2002 Dec 4. J Neurophysiol. 2003. PMID: 12612001
Cited by
- Rapid, activity-independent turnover of vesicular transmitter content at a mixed glycine/GABA synapse.
Apostolides PF, Trussell LO. Apostolides PF, et al. J Neurosci. 2013 Mar 13;33(11):4768-81. doi: 10.1523/JNEUROSCI.5555-12.2013. J Neurosci. 2013. PMID: 23486948 Free PMC article. - Short-term plasticity and auditory processing in the ventral cochlear nucleus of normal and hearing-impaired animals.
Wang Y, O'Donohue H, Manis P. Wang Y, et al. Hear Res. 2011 Sep;279(1-2):131-9. doi: 10.1016/j.heares.2011.04.018. Epub 2011 May 10. Hear Res. 2011. PMID: 21586317 Free PMC article. Review. - Spontaneous spiking and synaptic depression underlie noradrenergic control of feed-forward inhibition.
Kuo SP, Trussell LO. Kuo SP, et al. Neuron. 2011 Jul 28;71(2):306-18. doi: 10.1016/j.neuron.2011.05.039. Neuron. 2011. PMID: 21791289 Free PMC article. - Sustained firing of cartwheel cells in the dorsal cochlear nucleus evokes endocannabinoid release and retrograde suppression of parallel fiber synapses.
Sedlacek M, Tipton PW, Brenowitz SD. Sedlacek M, et al. J Neurosci. 2011 Nov 2;31(44):15807-17. doi: 10.1523/JNEUROSCI.4088-11.2011. J Neurosci. 2011. PMID: 22049424 Free PMC article. - Spontaneous Activity Defines Effective Convergence Ratios in an Inhibitory Circuit.
Lu HW, Trussell LO. Lu HW, et al. J Neurosci. 2016 Mar 16;36(11):3268-80. doi: 10.1523/JNEUROSCI.3499-15.2016. J Neurosci. 2016. PMID: 26985036 Free PMC article.
References
- Altschuler RA, Betz H, Parakkal MH, Reeks KA, Wenthold RJ. Identification of glycinergic synapses in the cochlear nucleus through immunocytochemical localization of the postsynaptic receptor. Brain Res 369: 316–320, 1986. - PubMed
- Beierlein M, Gibson JR, Connors BW. A network of electrically coupled interneurons drives synchronized inhibition in neocortex. Nat Neurosci 3: 904–910, 2000. - PubMed
- Berrebi AS, Mugnaini E. Distribution and targets of the cartwheel cell axon in the dorsal cochlear nucleus of the guinea pig. Anat Embryol 183: 427–454, 1991. - PubMed
- Blackstad TW, Osen KK, Mugnaini E. Pyramidal neurones of the dorsal cochlear nucleus: a Golgi and computer reconstruction study in cat. Neuroscience 13: 827–854, 1984. - PubMed
- Brawer JR, Morest DK, Kane EC. The neuronal architecture of the cochlear nucleus of the cat. J Comp Neurol 155: 251–300, 1974. - PubMed
Publication types
MeSH terms
LinkOut - more resources
Full Text Sources
Miscellaneous

