Transcriptional and electrophysiological maturation of neocortical fast-spiking GABAergic interneurons - PubMed (original) (raw)
Transcriptional and electrophysiological maturation of neocortical fast-spiking GABAergic interneurons
Benjamin W Okaty et al. J Neurosci. 2009.
Abstract
Fast-spiking (FS) interneurons are important elements of neocortical circuitry that constitute the primary source of synaptic inhibition in adult cortex and impart temporal organization on ongoing cortical activity. The highly specialized intrinsic membrane and firing properties that allow cortical FS interneurons to perform these functions are attributable to equally specialized gene expression, which is ultimately coordinated by cell-type-specific transcriptional regulation. Although embryonic transcriptional events govern the initial steps of cell-type specification in most cortical interneurons, including FS cells, the electrophysiological properties that distinguish adult cortical cell types emerge relatively late in postnatal development, and the transcriptional events that drive this maturational process are not known. To address this, we used mouse whole-genome microarrays and whole-cell patch clamp to characterize the transcriptional and electrophysiological maturation of cortical FS interneurons between postnatal day 7 (P7) and P40. We found that the intrinsic and synaptic physiology of FS cells undergoes profound regulation over the first 4 postnatal weeks and that these changes are correlated with primarily monotonic but bidirectional transcriptional regulation of thousands of genes belonging to multiple functional classes. Using our microarray screen as a guide, we discovered that upregulation of two-pore K(+) leak channels between P10 and P25 contributes to one of the major differences between the intrinsic membrane properties of immature and adult FS cells and found a number of other candidate genes that likely confer cell-type specificity on mature FS cells.
Figures
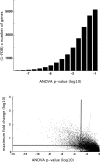
Figure 1.
Number of developmentally regulated genes and dynamic range of regulation. A, False discovery rate (FDR)-corrected frequency distribution of ANOVA p values. ANOVA p values were calculated for each gene across all measured time points (P7, P10, P15, P25, and P40, 3 microarrays per condition). The false discovery rate was estimated by subtracting the distribution of p values resulting from ANOVAs performed on randomly shuffled datasets. B, ANOVA p values plotted against maximum fold change for each gene. Horizontal and vertical lines demarcate arbitrary cutoff values for fold change (2-fold) and ANOVA p value (10−3), respectively.
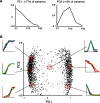
Figure 2.
Developmentally regulated genes exhibit mostly monotonically increasing or decreasing trajectories. PCA was performed on all genes with an associated ANOVA p value of <10−3 and a minimum twofold change in expression over development. Before performing PCA, expression profiles were normalized. A, Plot of the first and second principle components, accounting for ∼77 and ∼12% of the total variance, respectively. B, Plot of the first versus second principal component. Displayed trajectories are exemplars of the scaled expression trajectories of genes occupying a given region of PCA space, denoted by shaded discs.
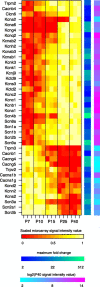
Figure 3.
Developmentally regulated ion channels. Heat maps denote (from left to right) the scaled microarray signal intensity, the maximum fold change, and log2 of the P40 microarray signal intensity value for each gene. Genes at the top are upregulated, and genes at the bottom are downregulated.
Figure 4.
Maturation of intrinsic membrane properties and the distinctive firing type of G42 FS interneurons. A, Representative voltage traces from each developmental point. Current injections were 90 pA (P7), 160 pA (P10), 300 pA (P15), and 580 pA (P25). Action potential trains are initially adapting but lose this property by P10, and the membrane becomes progressively less excitable. Also note the onset of “stuttering” spike trains evoked by threshold current injections at P10. B, Population F–I curves at each developmental point. Both current threshold and maximum firing rate increase dramatically over development. C, Summary data for input resistance (_R_In), voltage threshold, adaptation index (interspike interval ratio), current threshold, spike width, and maximum firing rate at each developmental point. All of these parameters progress monotonically over development. Error bars here and in other figures indicate SEM unless otherwise noted.
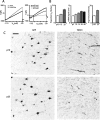
Figure 5.
The two-pore potassium leak channels TWIK1 and TASK1 are upregulated in G42 FS interneurons over postnatal development and exert increasing influence on membrane excitability. A, Average whole-cell currents evoked by a voltage ramp from −110 to −30 mV at P25 before and after bath application of 40 μ
m
bupivacaine (left). Average bupivacaine-sensitive currents at P7, P10, and P25. Dashed lines indicate zero current and the potassium equilibrium potential (_E_K, right). B, Bupivacaine-sensitive conductances account for a greater proportion of the whole-cell resting conductance as G42 FS interneurons mature (left). Right panels represent the increasing developmental trajectory of kcnk3 transcript levels measured by microarray and TASK1 protein detected by immunostaining. C, Immunostaining for TASK1 at P10 (top row) and P25 (bottom row). G42 FS interneurons are labeled with GFP, and the amount and intensity of TASK1 signal coextensive with GFP signal both increase between P10 and P25. Arrows in the TASK panels indicate the location of G42 somata in the same FOV. Scale bar, 40 μm.
Figure 6.
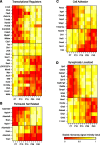
Developmentally regulated genes related to the following: A, transcriptional regulation; B, perineural nets; C, cell adhesion; and D, synaptic function. Heat maps denote the scaled microarray signal intensity. Given that scaling to the maximum and minimum value of a signal that is not significantly changing will amplify small perturbations from the mean and thereby give the appearance of dynamic regulation, signal values for stably expressed interneuron-specific transcription factors in the middle panel of A were scaled across microarray signal values from multiple cortical cell types (see Materials and Methods).
Figure 7.
Excitatory synaptic transmission undergoes extensive and non-monotonic maturation between P7 and P25. A, Representative current traces obtained at _V_Hold of −70 mV in the presence of GABAA receptor blockers and TTX at each age and corresponding average mEPSC waveforms (rightmost traces). Note the marked increase in mEPSC frequency over development. B, Summary data for mEPSC amplitude, decay time constant, and frequency. Both amplitude and frequency reach maxima at P15 and decline slightly by P25. C, The ratio of mEPSC to mIPSC frequency is large (∼4) early in development but decreases to ∼1 by P25, suggesting that excitatory inputs outweigh inhibitory ones for much of postnatal development in G42 FS interneurons.
Figure 8.
Inhibitory transmission is also strongly developmentally regulated in G42 FS interneurons. A, Representative voltage traces recorded at _V_Hold of −70 mV in the presence of glutamate receptor blockers, TTX, and with _E_Cl of 0 mV at each developmental point (left traces) and corresponding average mIPSC waveforms (right traces). The developmental decrease in the mIPSC decay time constant is very apparent. B, Population mIPSC amplitude, decay, and frequency averages over postnatal development. Unlike mEPSCs, maturational mIPSC changes are uniformly monotonic. C, The mIPSC decay time constant is inversely correlated with age and with the log of the gabra1/gabra5 ratio measured by microarray, suggesting that a GABAA receptor subunit switch is responsible for the striking decrease in mIPSC decay time constant over development. Error bars in C are propagated SEM.
Similar articles
- "Small axonless neurons": postnatally generated neocortical interneurons with delayed functional maturation.
Le Magueresse C, Alfonso J, Khodosevich K, Arroyo Martín AA, Bark C, Monyer H. Le Magueresse C, et al. J Neurosci. 2011 Nov 16;31(46):16731-47. doi: 10.1523/JNEUROSCI.4273-11.2011. J Neurosci. 2011. PMID: 22090500 Free PMC article. - Functional and molecular development of striatal fast-spiking GABAergic interneurons and their cortical inputs.
Plotkin JL, Wu N, Chesselet MF, Levine MS. Plotkin JL, et al. Eur J Neurosci. 2005 Sep;22(5):1097-108. doi: 10.1111/j.1460-9568.2005.04303.x. Eur J Neurosci. 2005. PMID: 16176351 - Synaptogenesis of electrical and GABAergic synapses of fast-spiking inhibitory neurons in the neocortex.
Pangratz-Fuehrer S, Hestrin S. Pangratz-Fuehrer S, et al. J Neurosci. 2011 Jul 27;31(30):10767-75. doi: 10.1523/JNEUROSCI.6655-10.2011. J Neurosci. 2011. PMID: 21795529 Free PMC article. - Highly energized inhibitory interneurons are a central element for information processing in cortical networks.
Kann O, Papageorgiou IE, Draguhn A. Kann O, et al. J Cereb Blood Flow Metab. 2014 Aug;34(8):1270-82. doi: 10.1038/jcbfm.2014.104. Epub 2014 Jun 4. J Cereb Blood Flow Metab. 2014. PMID: 24896567 Free PMC article. Review. - Transcriptional regulation of cortical interneuron development.
Butt SJ, Cobos I, Golden J, Kessaris N, Pachnis V, Anderson S. Butt SJ, et al. J Neurosci. 2007 Oct 31;27(44):11847-50. doi: 10.1523/JNEUROSCI.3525-07.2007. J Neurosci. 2007. PMID: 17978022 Free PMC article. Review. No abstract available.
Cited by
- Hierarchical clustering of gene expression patterns in the Eomes + lineage of excitatory neurons during early neocortical development.
Cameron DA, Middleton FA, Chenn A, Olson EC. Cameron DA, et al. BMC Neurosci. 2012 Aug 1;13:90. doi: 10.1186/1471-2202-13-90. BMC Neurosci. 2012. PMID: 22852769 Free PMC article. - Differential modulation of repetitive firing and synchronous network activity in neocortical interneurons by inhibition of A-type K(+) channels and Ih.
Williams SB, Hablitz JJ. Williams SB, et al. Front Cell Neurosci. 2015 Mar 18;9:89. doi: 10.3389/fncel.2015.00089. eCollection 2015. Front Cell Neurosci. 2015. PMID: 25852481 Free PMC article. - Pathway-driven discovery of epilepsy genes.
Noebels J. Noebels J. Nat Neurosci. 2015 Mar;18(3):344-50. doi: 10.1038/nn.3933. Epub 2015 Feb 24. Nat Neurosci. 2015. PMID: 25710836 Free PMC article. Review. - Selective expression of KCNS3 potassium channel α-subunit in parvalbumin-containing GABA neurons in the human prefrontal cortex.
Georgiev D, González-Burgos G, Kikuchi M, Minabe Y, Lewis DA, Hashimoto T. Georgiev D, et al. PLoS One. 2012;7(8):e43904. doi: 10.1371/journal.pone.0043904. Epub 2012 Aug 24. PLoS One. 2012. PMID: 22937123 Free PMC article. - Caudal Ganglionic Eminence Precursor Transplants Disperse and Integrate as Lineage-Specific Interneurons but Do Not Induce Cortical Plasticity.
Larimer P, Spatazza J, Espinosa JS, Tang Y, Kaneko M, Hasenstaub AR, Stryker MP, Alvarez-Buylla A. Larimer P, et al. Cell Rep. 2016 Aug 2;16(5):1391-1404. doi: 10.1016/j.celrep.2016.06.071. Epub 2016 Jul 14. Cell Rep. 2016. PMID: 27425623 Free PMC article.
References
- Ali AB. Involvement of post-synaptic kainate receptors during synaptic transmission between unitary connections in rat neocortex. Eur J Neurosci. 2003;17:2344–2350. - PubMed
- Bartos M, Vida I, Jonas P. Synaptic mechanisms of synchronized gamma oscillations in inhibitory interneuron networks. Nat Rev Neurosci. 2007;8:45–56. - PubMed
Publication types
MeSH terms
Substances
LinkOut - more resources
Full Text Sources
Other Literature Sources
Molecular Biology Databases
