Early postnatal proteolipid promoter-expressing progenitors produce multilineage cells in vivo - PubMed (original) (raw)
Early postnatal proteolipid promoter-expressing progenitors produce multilineage cells in vivo
Fuzheng Guo et al. J Neurosci. 2009.
Abstract
Proteolipid promoter (plp promoter) activity in the newborn mouse CNS is restricted to NG2-expressing oligodendroglial progenitor cells and oligodendrocytes. There are two populations of NG2 progenitors based on their plp promoter expression. Whereas the general population of NG2 progenitors has been shown to be multipotent in vitro and after transplantation, it is not known whether the subpopulation of plp promoter-expressing NG2 progenitors [i.e., plp promoter-expressing NG2 progenitors (PPEPs)] has the potential to generate multilineage cells during normal development in vivo. We addressed this issue by fate mapping Plp-Cre-ER(T2)/Rosa26-EYFP (PCE/R) double-transgenic mice, which carried an inducible Cre gene under the control of the plp promoter. Expression of the enhanced yellow fluorescent protein (EYFP) reporter gene in PPEPs was elicited by administering tamoxifen to postnatal day 7 PCE/R mice. We have demonstrated that early postnatal PPEPs, which had been thought to be restricted to the oligodendroglial lineage, also unexpectedly gave rise to a subset of immature, postmitotic, protoplasmic astrocytes in the gray matter of the spinal cord and ventral forebrain, but not in white matter. Furthermore, these PPEPs also gave rise to small numbers of immature, DCX (doublecortin)-negative neurons in the ventral forebrain, dorsal cerebral cortex, and hippocampus. EYFP-labeled representatives of each of these lineages survived to adulthood. These findings indicate that there are regional differences in the fates of neonatal PPEPs, which are multipotent in vivo, giving rise to oligodendrocytes, astrocytes, and neurons.
Figures
Figure 1.
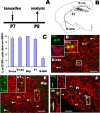
A subpopulation of early postnatal NG2+ oligodendrocyte progenitor cells is targeted by Cre-mediated recombination. A, Experimental design: two tamoxifen intraperitoneal injections at P7 and analysis at P8. B, Diagram showing anatomical structures of mouse forebrain examined in our study in partial coronal section. C, Percentage of EYFP+ cells that expressed NG2 in different areas. Error bars indicate SD. D–F, Double immunohistochemical staining shows that a subset of NG2+ (red) progenitors expressed the reporter gene, EYFP (green), in dorsal cortex (D), hippocampus (E), and fimbria (F). The boxed areas in D–F are shown at higher magnification. The arrowheads point to EYFP+/NG2+ cells. The blue channel in the images shows Hoechst 33258+ nuclei. S-GM, Spinal cord gray matter. Scale bars: 50 μm (applied to all).
Figure 2.
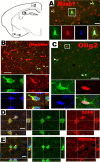
Phenotypic features of PPEPs. Plp promoter-expressing progenitors expressed Mash1 (A), Nestin (B), Olig2 (C), EGFR (D), and PDGFRα (E). The diagram at the top left indicates the locations where the images in A–E were obtained. B, D, and E show orthogonal view, whereas A and C show projection view. Cells in the boxed area in A and C, and at crosshair in B, are shown at higher magnification. The arrowheads point to double-positive cells. Scale bars: A–C, 50 μm; D, E, 10 μm.
Figure 3.
Proliferative potential of EYFP+ PPEPs. Two hours before being killed at P8, mice were injected with BrdU. Many BrdU+ (blue) PPEPs (i.e., BrdU+/EYFP+/NG2+ cells) were present in the gray matter, dorsal cortex (A), and white matter, fimbria (B). Consistent with the BrdU results, Ki67+ (red)/EYFP+ PPEPs were distributed in dorsal cortex (D) and fimbria (E). Cells a1, a2 in A; d1, d2, d3 in D; and boxed areas in B and E were shown at higher magnification accordingly. The arrows point to proliferative PPEPs in all images. C, Percentages of proliferating EYFP+ PPEPs in different areas evaluated by BrdU and Ki67, respectively. Error bars indicate SD. S-GM, Spinal cord gray matter. Scale bars: 50 μm (applied to all).
Figure 4.
EYFP-tagged PPEPs generate mature oligodendrocytes. A1–A3, Triple-positive EYFP (green), NG2 (blue), and APC (red) cells in hippocampus CA3 region. The arrowheads (for example, cell a1) in A1–A3 point to examples of EYFP+/NG2+/APC− progenitors; the arrows (cell a2), EYFP+/NG2−/APC+ mature oligodendrocytes; whereas wavy arrows (cell a3) point to EYFP+/NG2+/APC+ transitional stage. Cells marked with a1, a2, and a3 are shown at higher magnification below A1–A3. Mature oligodendrocytes were also identified by another mature oligodendrocyte marker, GST-Pi, in hippocampus (B). C, EYFP/APC double staining in fimbria showed virtually all of the EYFP+ cells were APC+ mature oligodendrocytes, and the arrows point to examples of mature oligodendrocytes with parallel myelinating processes. Blue in B and C are Hoechst 33258+ nuclei. All images obtained from P15 mice. Scale bars: 50 μm (applied to all).
Figure 5.
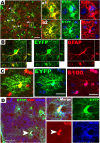
Early postnatal PPEPs give rise to gray matter protoplasmic astrocytes. At P15, 8 d after tamoxifen treatment, a subpopulation of EYFP+ cells (green) were labeled with the astroglial markers BLBP (A), GFAP (B), and S100-β (C). The higher magnification in boxed area a1 in A shows an example of EYFP+/BLBP+ astrocytes with few processes that were newly generated from EYFP+ PPEPs. EYFP+/BLBP+ astrocytes are usually distributed in clusters (A, arrowheads) or in doublets (D, arrowhead). EdU incorporation experiment showed that newly formed EYFP+/BLBP+ astrocytes were EdU immunoreactive with a single injection at P7 (arrowhead and higher magnification image in D). B is orthogonal view showing x–z and y–z axes, and the others are projection view. All pictures were from ventral cortex of forebrain. Scale bars: A, D, 50 μm; B, C, 20 μm.
Figure 6.
EYFP-tagged PPEPs produce immature astrocytes. A and B show triple immunostaining for EYFP (green), vimentin (Vim) (red), and GFAP (blue) of P10 and P15 spinal cord gray matter (S-GM), respectively. Cells labeled with a1–b2 are shown at higher magnification and display an astroglial maturation progression evaluated by vimentin and GFAP staining, with a1 cell being most immature and b2 cell being most mature. The asterisk in B shows central canal. Scale bars: 50 μm (applied to all).
Figure 7.
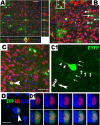
A subpopulation of neurons are produced from EYFP-tagged PPEPs. EYFP+ (green) neurons in the P15 ventral cortex are stained with neuronal marker NeuN (A, red) and HuC/D (B, red). A, Orthogonal views of neuron at the crosshair, showing colocalization of EYFP with NeuN. The boxed area in B shows clustered EYFP+ neurons. C, EYFP+/NeuN+ neurons from P60 adult had the appearance of pyramidal neurons, and the cell marked with arrowhead is shown at higher magnification in C1 (EYFP, green; NeuN, red). The arrowheads and arrows in C1 point to apical (marked with asterisk) and basal dendrites, respectively, whereas the wavy arrows point to axon extending to subcortical whiter matter. D, PPEP-derived neurons (EYFP+/HuC/D+) are EdU (red) positive in the P15 ventral cortex. D1 depicts five consecutive 1 μm confocal images in the _z_-dimension of the neuron indicated by arrowhead in E, showing colocalization of EYFP, HuC/D, and EdU. Scale bars: A, D, 30 μm; B, C, 50 μm.
Figure 8.
EYFP-tagged PPEPs generate hippocampal GABAergic interneurons. PPEP-derived neurons in the P15 hippocampus express reporter gene EYFP (green) and are labeled with neuronal marker, HuC/D (A–A3, red) and NeuN (D–D2, red). The boxed areas in A are depicted at higher magnification in A1–A3. The EYFP+ neurons expressed the GABAergic interneuron marker, GAD67 (D, crosshair, and higher magnification, red). The arrows in D point to examples of GAD67+/EYFP− neurons. B–B3 show the neurons generated from EYFP-tagged PPEPs (EYFP, green; HuC/D, blue) in the hippocampus were somatastatin (SOM) (red)-expressing interneurons. B and D are orthogonal views with x–z and y–z axes. Blue in A, C, and D are Hoechst+ nuclei. The location of each picture is indicated in the schematic drawing of the hippocampus. Scale bars: A, D, 50 μm; B, C, 10 μm.
Similar articles
- Olig2/Plp-positive progenitor cells give rise to Bergmann glia in the cerebellum.
Chung SH, Guo F, Jiang P, Pleasure DE, Deng W. Chung SH, et al. Cell Death Dis. 2013 Mar 14;4(3):e546. doi: 10.1038/cddis.2013.74. Cell Death Dis. 2013. PMID: 23492777 Free PMC article. - Transient Cnp expression by early progenitors causes Cre-Lox-based reporter lines to map profoundly different fates.
Tognatta R, Sun W, Goebbels S, Nave KA, Nishiyama A, Schoch S, Dimou L, Dietrich D. Tognatta R, et al. Glia. 2017 Feb;65(2):342-359. doi: 10.1002/glia.23095. Epub 2016 Nov 3. Glia. 2017. PMID: 27807896 Free PMC article. - Postnatal NG2 proteoglycan-expressing progenitor cells are intrinsically multipotent and generate functional neurons.
Belachew S, Chittajallu R, Aguirre AA, Yuan X, Kirby M, Anderson S, Gallo V. Belachew S, et al. J Cell Biol. 2003 Apr 14;161(1):169-86. doi: 10.1083/jcb.200210110. Epub 2003 Apr 7. J Cell Biol. 2003. PMID: 12682089 Free PMC article. - Identity, distribution, and development of polydendrocytes: NG2-expressing glial cells.
Nishiyama A, Watanabe M, Yang Z, Bu J. Nishiyama A, et al. J Neurocytol. 2002 Jul-Aug;31(6-7):437-55. doi: 10.1023/a:1025783412651. J Neurocytol. 2002. PMID: 14501215 Review. - Instructive niches: environmental instructions that confound NG2 proteoglycan expression and the fate-restriction of CNS progenitors.
Sellers DL, Horner PJ. Sellers DL, et al. J Anat. 2005 Dec;207(6):727-34. doi: 10.1111/j.1469-7580.2005.00480.x. J Anat. 2005. PMID: 16367800 Free PMC article. Review.
Cited by
- A bimodal influence of thyroid hormone on cerebellum oligodendrocyte differentiation.
Picou F, Fauquier T, Chatonnet F, Flamant F. Picou F, et al. Mol Endocrinol. 2012 Apr;26(4):608-18. doi: 10.1210/me.2011-1316. Epub 2012 Feb 23. Mol Endocrinol. 2012. PMID: 22361821 Free PMC article. - Chronic fluoxetine increases extra-hippocampal neurogenesis in adult mice.
Sachs BD, Caron MG. Sachs BD, et al. Int J Neuropsychopharmacol. 2014 Oct 31;18(4):pyu029. doi: 10.1093/ijnp/pyu029. Int J Neuropsychopharmacol. 2014. PMID: 25583694 Free PMC article. - Newborn cortical neurons: only for neonates?
Feliciano DM, Bordey A. Feliciano DM, et al. Trends Neurosci. 2013 Jan;36(1):51-61. doi: 10.1016/j.tins.2012.09.004. Epub 2012 Oct 11. Trends Neurosci. 2013. PMID: 23062965 Free PMC article. Review. - Unwrapping myelination by microRNAs.
He X, Yu Y, Awatramani R, Lu QR. He X, et al. Neuroscientist. 2012 Feb;18(1):45-55. doi: 10.1177/1073858410392382. Epub 2011 May 2. Neuroscientist. 2012. PMID: 21536841 Free PMC article. Review. - Cortical spreading depression shifts cell fate determination of progenitor cells in the adult cortex.
Tamura Y, Eguchi A, Jin G, Sami MM, Kataoka Y. Tamura Y, et al. J Cereb Blood Flow Metab. 2012 Oct;32(10):1879-87. doi: 10.1038/jcbfm.2012.98. Epub 2012 Jul 11. J Cereb Blood Flow Metab. 2012. PMID: 22781335 Free PMC article.
References
- Alonso G. NG2 proteoglycan-expressing cells of the adult rat brain: possible involvement in the formation of glial scar astrocytes following stab wound. Glia. 2005;49:318–338. - PubMed
- Bai J, Ramos RL, Ackman JB, Thomas AM, Lee RV, LoTurco JJ. RNAi reveals doublecortin is required for radial migration in rat neocortex. Nat Neurosci. 2003;6:1277–1283. - PubMed
Publication types
MeSH terms
Substances
LinkOut - more resources
Full Text Sources
Medical
Molecular Biology Databases
Research Materials


