A genome scan for positive selection in thoroughbred horses - PubMed (original) (raw)
A genome scan for positive selection in thoroughbred horses
Jingjing Gu et al. PLoS One. 2009.
Abstract
Thoroughbred horses have been selected for exceptional racing performance resulting in system-wide structural and functional adaptations contributing to elite athletic phenotypes. Because selection has been recent and intense in a closed population that stems from a small number of founder animals Thoroughbreds represent a unique population within which to identify genomic contributions to exercise-related traits. Employing a population genetics-based hitchhiking mapping approach we performed a genome scan using 394 autosomal and X chromosome microsatellite loci and identified positively selected loci in the extreme tail-ends of the empirical distributions for (1) deviations from expected heterozygosity (Ewens-Watterson test) in Thoroughbred (n = 112) and (2) global differentiation among four geographically diverse horse populations (F(ST)). We found positively selected genomic regions in Thoroughbred enriched for phosphoinositide-mediated signalling (3.2-fold enrichment; P<0.01), insulin receptor signalling (5.0-fold enrichment; P<0.01) and lipid transport (2.2-fold enrichment; P<0.05) genes. We found a significant overrepresentation of sarcoglycan complex (11.1-fold enrichment; P<0.05) and focal adhesion pathway (1.9-fold enrichment; P<0.01) genes highlighting the role for muscle strength and integrity in the Thoroughbred athletic phenotype. We report for the first time candidate athletic-performance genes within regions targeted by selection in Thoroughbred horses that are principally responsible for fatty acid oxidation, increased insulin sensitivity and muscle strength: ACSS1 (acyl-CoA synthetase short-chain family member 1), ACTA1 (actin, alpha 1, skeletal muscle), ACTN2 (actinin, alpha 2), ADHFE1 (alcohol dehydrogenase, iron containing, 1), MTFR1 (mitochondrial fission regulator 1), PDK4 (pyruvate dehydrogenase kinase, isozyme 4) and TNC (tenascin C). Understanding the genetic basis for exercise adaptation will be crucial for the identification of genes within the complex molecular networks underlying obesity and its consequential pathologies, such as type 2 diabetes. Therefore, we propose Thoroughbred as a novel in vivo large animal model for understanding molecular protection against metabolic disease.
Conflict of interest statement
Competing Interests: The authors have declared that no competing interests exist.
Figures
Figure 1. Empirical distribution for Dh/sd.
The empirical distribution for Dh/sd scores (horizontal axis) from the Ewens-Watterson test. The vertical axis indicates the number of loci with the corresponding Dh/sd score. The positions in the distribution of the regions that have been subject to selection in Thoroughbred are indicated by the gene symbols for the strongest candidate genes. Genes in the negative tail-end of the distribution may have been subject to positive selection. Genes in the positive end of the distribution may have been subject to balancing selection.
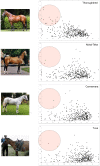
Figure 2. F ST versus heterozygosity.
F ST (vertical axis) versus heterozygosity (horizontal axis) plots for Thoroughbred, Akhal-Teke, Connemara and Tuva at 394 genome-wide microsatellite loci.
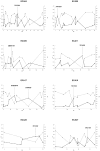
Figure 3. Chromosome-wide F ST versus Thoroughbred heterozygosity.
F ST (solid line) versus Thoroughbred heterozygosity (dashed line) plots across chromosomes for the nine highest F ST regions with significant (P<0.05) deviations from expected heterozygosity (Dh/sd) in Thoroughbred. Loci defining selected genomic regions are highlighted. Left vertical axis: F ST; Right vertical axis: Thoroughbred heterozygosity; Horizontal axis: chromosome position (Mb).
Figure 4. Empirical distribution for F ST.
The empirical distribution for global differentiation, F ST (horizontal axis). The vertical axis indicates the number of loci with the corresponding F ST. The positions of the regions that have been subject to positive selection in Thoroughbred are located in the tail-end of the distribution and are indicated by the gene symbols for the strongest candidate genes.
Similar articles
- Genomic inbreeding trends, influential sire lines and selection in the global Thoroughbred horse population.
McGivney BA, Han H, Corduff LR, Katz LM, Tozaki T, MacHugh DE, Hill EW. McGivney BA, et al. Sci Rep. 2020 Jan 16;10(1):466. doi: 10.1038/s41598-019-57389-5. Sci Rep. 2020. PMID: 31949252 Free PMC article. - Targets of selection in the Thoroughbred genome contain exercise-relevant gene SNPs associated with elite racecourse performance.
Hill EW, Gu J, McGivney BA, MacHugh DE. Hill EW, et al. Anim Genet. 2010 Dec;41 Suppl 2:56-63. doi: 10.1111/j.1365-2052.2010.02104.x. Anim Genet. 2010. PMID: 21070277 - Common protein-coding variants influence the racing phenotype in galloping racehorse breeds.
Han H, McGivney BA, Allen L, Bai D, Corduff LR, Davaakhuu G, Davaasambuu J, Dorjgotov D, Hall TJ, Hemmings AJ, Holtby AR, Jambal T, Jargalsaikhan B, Jargalsaikhan U, Kadri NK, MacHugh DE, Pausch H, Readhead C, Warburton D, Dugarjaviin M, Hill EW. Han H, et al. Commun Biol. 2022 Dec 13;5(1):1320. doi: 10.1038/s42003-022-04206-x. Commun Biol. 2022. PMID: 36513809 Free PMC article. - Genetics of Thoroughbred Racehorse Performance.
Bailey E, Petersen JL, Kalbfleisch TS. Bailey E, et al. Annu Rev Anim Biosci. 2022 Feb 15;10:131-150. doi: 10.1146/annurev-animal-020420-035235. Epub 2021 Nov 15. Annu Rev Anim Biosci. 2022. PMID: 34780248 Review. - Candidate genes for physical performance in the horse.
Schröder W, Klostermann A, Distl O. Schröder W, et al. Vet J. 2011 Oct;190(1):39-48. doi: 10.1016/j.tvjl.2010.09.029. Epub 2010 Nov 5. Vet J. 2011. PMID: 21115378 Review.
Cited by
- Genome-wide SNP analysis of Japanese Thoroughbred racehorses.
Fawcett JA, Sato F, Sakamoto T, Iwasaki WM, Tozaki T, Innan H. Fawcett JA, et al. PLoS One. 2019 Jul 24;14(7):e0218407. doi: 10.1371/journal.pone.0218407. eCollection 2019. PLoS One. 2019. PMID: 31339891 Free PMC article. - A sequence polymorphism in MSTN predicts sprinting ability and racing stamina in thoroughbred horses.
Hill EW, Gu J, Eivers SS, Fonseca RG, McGivney BA, Govindarajan P, Orr N, Katz LM, MacHugh DE. Hill EW, et al. PLoS One. 2010 Jan 20;5(1):e8645. doi: 10.1371/journal.pone.0008645. PLoS One. 2010. PMID: 20098749 Free PMC article. - Identification of selection signatures in livestock species.
de Simoni Gouveia JJ, da Silva MV, Paiva SR, de Oliveira SM. de Simoni Gouveia JJ, et al. Genet Mol Biol. 2014 Jun;37(2):330-42. doi: 10.1590/s1415-47572014000300004. Genet Mol Biol. 2014. PMID: 25071397 Free PMC article. Review. - Signatures of selection in five Italian cattle breeds detected by a 54K SNP panel.
Mancini G, Gargani M, Chillemi G, Nicolazzi EL, Marsan PA, Valentini A, Pariset L. Mancini G, et al. Mol Biol Rep. 2014 Feb;41(2):957-65. doi: 10.1007/s11033-013-2940-5. Epub 2014 Jan 19. Mol Biol Rep. 2014. PMID: 24442315 Free PMC article. - Adaptations to climate-mediated selective pressures in sheep.
Lv FH, Agha S, Kantanen J, Colli L, Stucki S, Kijas JW, Joost S, Li MH, Ajmone Marsan P. Lv FH, et al. Mol Biol Evol. 2014 Dec;31(12):3324-43. doi: 10.1093/molbev/msu264. Epub 2014 Sep 23. Mol Biol Evol. 2014. PMID: 25249477 Free PMC article.
References
- Levine M. The origins of horse husbandry on the Eurasian Steppe. In: Levine M, Rassamakin Y, Kislenko A, Tatarintseva N, editors. Late prehistoric exploitation of the Eurasian steppe. Cambridge: McDonald Institute for Archaeological Research; 1999. pp. 5–58.
- Jones JH, Lindstedt SL. Limits to maximal performance. Annu Rev Physiol. 1993;55:547–569. - PubMed
- Jones JH, Longworth KE, Lindholm A, Conley KE, Karas RH, et al. Oxygen transport during exercise in large mammals. I. Adaptive variation in oxygen demand. J Appl Physiol. 1989;67:862–870. - PubMed
- Young LE, Marlin DJ, Deaton C, Brown-Feltner H, Roberts CA, et al. Heart size estimated by echocardiography correlates with maximal oxygen uptake. Equine Vet J. 2002;(Suppl):467–471. - PubMed
- Constantinopol M, Jones JH, Weibel ER, Taylor CR, Lindholm A, et al. Oxygen transport during exercise in large mammals. II. Oxygen uptake by the pulmonary gas exchanger. J Appl Physiol. 1989;67:871–878. - PubMed
Publication types
MeSH terms
LinkOut - more resources
Full Text Sources
Other Literature Sources
Miscellaneous


